The following graph shows an increase in short-run aggregate supply (SRAS) in a hypothetical economy. Specifically, short-run aggregate supply shifts to the right from SRAS₁ to SRAS2, causing the quantity of output supplied at a price level of 125 to rise from $250 billion to $350 billion. Review the graph and then complete the table that follows. PRICE LEVEL 200 175 150 125 100 75 50 25 0 0 50 SRAS SRAS₂ 100 150 200 250 300 350 400 REAL GDP (Billions of dollars) Determinant Input Prices Burdensome Regulations Technology The following table lists several determinants of short-run aggregate supply. Complete the table by indicating the change needed in each determinant to increase short-run aggregate supply. ? Change Needed to Increase SRAS increase or decrease increase or decrease decline or improvement
The following graph shows an increase in short-run aggregate supply (SRAS) in a hypothetical economy. Specifically, short-run aggregate supply shifts to the right from SRAS₁ to SRAS2, causing the quantity of output supplied at a price level of 125 to rise from $250 billion to $350 billion. Review the graph and then complete the table that follows. PRICE LEVEL 200 175 150 125 100 75 50 25 0 0 50 SRAS SRAS₂ 100 150 200 250 300 350 400 REAL GDP (Billions of dollars) Determinant Input Prices Burdensome Regulations Technology The following table lists several determinants of short-run aggregate supply. Complete the table by indicating the change needed in each determinant to increase short-run aggregate supply. ? Change Needed to Increase SRAS increase or decrease increase or decrease decline or improvement

Chapter20: Aggregate Demand And Supply
Section: Chapter Questions
Problem 8SQP

Related questions
Question
100%
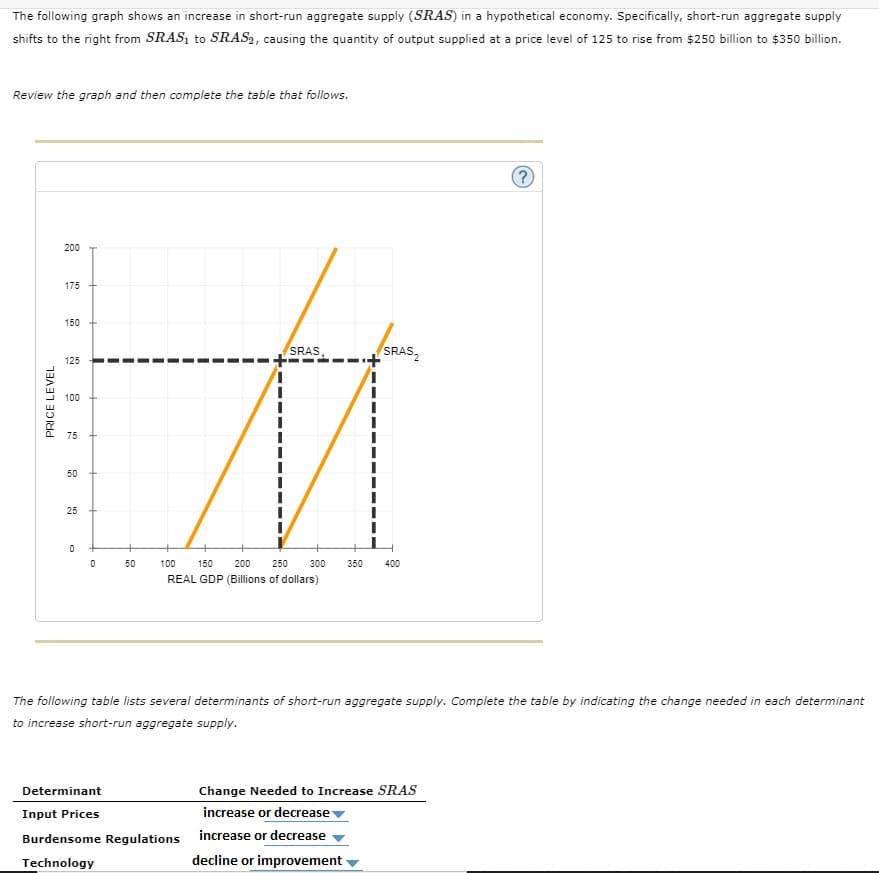
Transcribed Image Text:The following graph shows an increase in short-run aggregate supply (SRAS) in a hypothetical economy. Specifically, short-run aggregate supply
shifts to the right from SRAS₁ to SRAS2, causing the quantity of output supplied at a price level of 125 to rise from $250 billion to $350 billion.
Review the graph and then complete the table that follows.
PRICE LEVEL
200
175
150
125
100
75
50
25
0
0
50
SRAS
SRAS₂
100 150 200 250 300 350 400
REAL GDP (Billions of dollars)
?
The following table lists several determinants of short-run aggregate supply. Complete the table by indicating the change needed in each determinant
to increase short-run aggregate supply.
Determinant
Change Needed to Increase SRAS
Input Prices
increase or decrease
Burdensome Regulations increase or decrease
Technology
decline or improvement
Expert Solution
This question has been solved!
Explore an expertly crafted, step-by-step solution for a thorough understanding of key concepts.

This is a popular solution!

Trending now
This is a popular solution!

Step by step
Solved in 2 steps

Knowledge Booster


Learn more about
Need a deep-dive on the concept behind this application? Look no further. Learn more about this topic, economics and related others by exploring similar questions and additional content below.Recommended textbooks for you


Economics: Private and Public Choice (MindTap Cou…
Economics
ISBN:
9781305506725
Author:
James D. Gwartney, Richard L. Stroup, Russell S. Sobel, David A. Macpherson
Publisher:
Cengage Learning

Macroeconomics: Private and Public Choice (MindTa…
Economics
ISBN:
9781305506756
Author:
James D. Gwartney, Richard L. Stroup, Russell S. Sobel, David A. Macpherson
Publisher:
Cengage Learning

Economics (MindTap Course List)
Economics
ISBN:
9781337617383
Author:
Roger A. Arnold
Publisher:
Cengage Learning