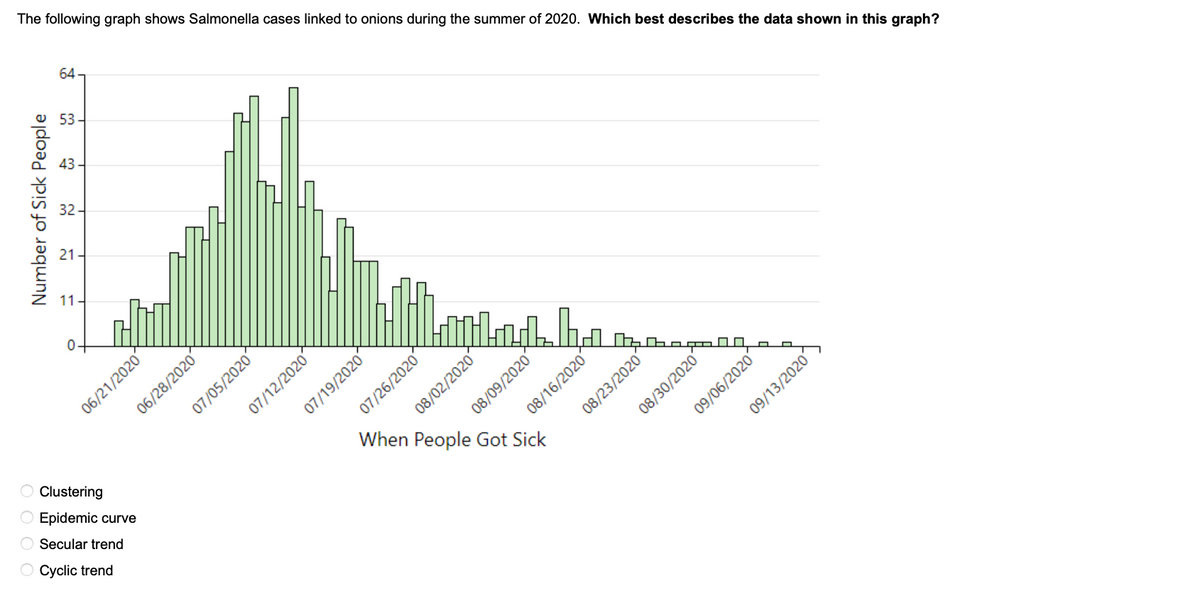
The following graph shows Salmonella cases linked to onions during the summer of 2020. Which best describes the data shown in this graph? of Sick People Number 64 11- 0- 06/21/20201 Clustering Epidemic curve Secular trend OCyclic trend 06/28/2020 07/05/20201 07/12/2020 07/19/20201 07/26/2020 Mlad 08/02/2020 08/09/2020 When People Got Sick ha 08/16/2020 140 Ch 08/23/2020 08/30/2020 09/06/2020 09/13/2020


Q: It is well-established in the research that the greater number of people around, the less likely an…
A: Given Information: Claim: the greater number of people around, the less likely an individual is to…
Q: In the dataset, a Volkswagen Beetle has a displacement equal to 2.0 and fuel economy equal to 26.…
A: The regression equation is given by MPG = 37.49079 - 4.357743 Displacement
Q: tion) Men Women Total
A: Cyclic trend is regularly recurring pattern. In this type of trend given scenario happening again…
Q: L value Za/2, or (c) state that neither the normal distribution nor the t distribution applies. The…
A: It is given that the confidence level is 90%, σ is not known and the histogram of 60 player salaries…
Q: If 2 specific persons among the 10 people lined up to get on the bus refuse on following each other…
A:
Q: Observations 3.481 3.477 3.470 3.448 3.472 3.470 3.485 3.464 3.477 3.475 3.472 3.473 3.472 3.470
A: The given data is 3481 3448 3485 3475 3472 3477 3472 3464 3472 3470 3470…
Q: Suppose a doctor measures the height, x, and head circumference, y, of 8 children and obtains the…
A: Given: The correlation coefficient r = 0.860 The regression line is: Y = 0.209X + 11.647 Formula…
Q: Let X be a discrete random variable with probabilities as shown in Table 3.4. Find the third central…
A: Data given X 0 1 2 3 P(X) 1/3 1/6 1/4 1/4
Q: The thickness of a flange on an aircraft component is uniformly distributed between 0.95 and 1.05…
A: Given: The thickness of a flange on an aircraft component is uniformly distributed between a=0.95…
Q: A study investigated the effect of the length and the repetition of TV advertisements on students'…
A: Since you have posted a question with multiple subparts, we will solve first three subparts for you.…
Q: K Use the given information to find the number of degrees of freedom, the critical values X and X,…
A: It is given that n = 23 s = 65.6
Q: The days to maturity for a sample of five money market funds are shown here. The dollar amounts…
A: Given that Let X=days w = dollar x w x⋅w 2 15 30 5 20 100 7 10 70 14 10 140 19 30 570…
Q: b) is the relevant probability. b. Since the probability of getting 4 sleepwalkers is the result…
A: Note: According to Bartleby guidelines we can solve maximum of three subparts in a question and rest…
Q: Home Sales Prices (hundred thousands) (ten thousands) 0 667778999 1 02447778889999 2…
A: Given that Stem and leaf plot Home Sales Prices (hundred thousands) = Stem (ten thousands) =…
Q: In linear regression, the most popular and widely used method to estimate the parameters of an…
A: Least square method in statistics is widely used to obtain a best fitting line for a data set. In…
Q: People waiting to get vaccinated have to wait an average of 45 minutes before they receive their…
A: From the provided information, Mean (µ) = 45 Standard deviation (σ) = 5 X~N (45, 5)
Q: Which of the following sentences is the correct interpretation of the slope? For every one unit…
A: The regression equation is given by MPG = 37.49079 - 4.357743 Displacement
Q: In a test of the effectiveness of garlic for lowering cholesterol, 50 subjects were treated with…
A: It is given that Sample size n = 50 Sample mean difference = 5.7 Sample SD s = 16.5 Confidence level…
Q: Express the confidence interval 0.444 <p<0.888 in the form p±E. p±E= ±
A: given data ci for proportion : 0.444<p<0.888 find this ci in p⏞ ±E form
Q: 5. The following data refer to the profits of a store in thousand taka for the last 6 months are 9,…
A:
Q: A friend of mine is giving a dinner party. His current wine supply includes 9 bottles of zinfandel,…
A: As per our guidelines we are suppose to answer only three sub parts. Given,no.of zinfandel…
Q: The diameter of a particle of contamination (in micrometers) is modeled with the probability density…
A: Ans# The probability density function is f(x) = 2x3 , for x > 1 Find (d) P(X…
Q: Seventy-eight percent of the light aircraft that disappear while in flight in a certain country are…
A:
Q: An automobile manufacturer decides to carry out a fuel efficiency test to determine if it can…
A: Given For previous model Sample size=n1=6, sample mean x̄1=29.5, standard deviations s1=1.41 For…
Q: a. Find the mean, μ = b. Find the standard deviation, σ =
A: Given: A train arrives every eight minutes. The length of time follows uniform distribution.
Q: Midterm exam scores for a small advanced neuroanatomy class are provided below. Scores represent the…
A: Given: Scores 87 99 75 87 94 75 35 88 87 93
Q: 1 The figure at the bottom of the page shows the probability density of colony diameters (in mm) in…
A: Basic concepts of normal probability distribution area property are used ND the graph above…
Q: What is the definition of level of significance? Use the terms alpha level, level of significance,…
A: The level of significance is denoted by alpha, that is the probability of Type 1 error which is the…
Q: Select one: O a. b₁ = 12 O b. Y = 12+18X; c. The predicted mark obtained if an applicant studied…
A: It is given that ΣX = 32 ΣY = 528 ΣXY = 2136 ΣX2 = 130 ΣY2 = 34872 n = 8
Q: a. Use the summation operator (Σ) to simplify the following expressions (where X and Y are…
A:
Q: What type of test will I use in the comparative study if I am comparing three or four and then I…
A: If only equality of two means of two different populations are tested, then always two-sample t-test…
Q: A student selects 49 batteries from a population with a mean mass value of 72±7.0 g (u±s). She…
A: Given information: μ=72, σ=7x¯=74, n=49
Q: Consider the following data: 4 6 8 12 16 25 Which of the following statements is correct? X Y Select…
A: Given that X Y X \cdot YX⋅Y X^2X2 Y^2Y2 4 12 48 16 144 6 16 96 36 256 8 25 200 64…
Q: Data was collected on the number of traffic fatalities per year in a variety of vehicles and for a…
A: The formula of the range is, Max denotes the Maximum value. Min denotes the Minimum value.
Q: A collegiate long jumper is hoping to improve his distance with a new conditioning routine. The new…
A: Given Information: Prior to the new program, the jumper was averaging 24.5 feet per jump. After the…
Q: Use a standard distribution table to find a z-score such that 10.03% of the area under the standard…
A: We have to find the z such that P(Z > z) = 10.03% = 0.1003
Q: A random sample X1,...,Xn has density as the one shown in the image A) whats the distribution of…
A: It is given that X1, X2, ...., Xn is a i.i.d random sample from the distribution with PDF given by:…
Q: The Mathematics section of the ACT test had a mean of 20.9 and an SD of 5.3 for the years 2013-2015.…
A:
Q: The yearly number of traffic fatalities involving a bus is given below. 18 18 18 21 22 26 27 28 31…
A: From the provided information, Number of observations (n) = 27
Q: Find the median for the following data 9,12,24,18,16,11,7,4,23
A: Answer: Given data is, 9,12,24,18,16,11,7,4,23 We have to find the median of this data.
Q: K The ages of a group of 126 randomly selected adult females have a standard deviation of 17.2…
A: We have given Standard deviation(σ) = 17.2Margin of error (E) = 1/2 = 0.5Significance level (α) = 1…
Q: Venus Flycatcher Company sells exotic plants and is trying to decide which of two hybrid plants to…
A: Given data:
Q: 4 3 ww 2 Page 3: Page 4: age 5: Page 1: Page 2: 1 Suppose n-247, Ex-2812, 1x²-35920.89, Zy-2898.67,…
A:
Q: An experiment investigated the effect of length and repetition of TV ads on students choosing to eat…
A: Experiment is the study used to understand the population. It involves some treatments or technique…
Q: Part 2 The standard deviation of the sample data is enter your response here ▼ nights squared…
A: The given prices are 117, 92, 127, 251, 178, 219, 227, 224.
Q: a) About % percent of students scored over 30.
A: Given that. X~N( μ , ?2 ) μ=20.9 , ?=5.3 Z-score =( x - μ )/? NOTE:- mentioned in question…
Q: ata was collected on 500 high school students to help determine which factors are associated with…
A: Quantitative data: Quantitative data is the value of data in the form of counts or numbers. Here…
Q: K The data given to the right includes data from 43 candies, and 7 of them are red. The company that…
A: It is given that Sample size n = 43 Number of red candies X = 7 Confidence level = 90%
Q: A project manager asked ten engineers how many projects they had engaged in the last 12 months.…
A: The question is about graphical representation of data Introduction : Stem and Leaf plot : It is a…
Q: If X is a discrete random variable with probability mass function given as in Table 3.1, find (1)…
A:
19.

Step by step
Solved in 2 steps

- The following is data on urea fertilizer production (tonnes) in 2011-2020successively as follows: 4, 8, 12, 10, 13, 15, 14, 21, 32 and 20. Determine the value of the trend production using the Moving Average Method!Under what circumstances would the trendline be significantly deviated by an outlier?Based on the given sales volume of AZ’s sanitizer product for 16 weeks, construct the trend projection using graphs, 3 weeks moving average, and exponential smoothing methods. Weeks Sanitizer sales 1 5600 2 5200 3 4570 4 4305 5 5465 6 8900 7 15680 8 24680 9 35040 10 36500 11 38575 12 35300 13 35200 14 35150 15 34950 16 34500
- The report “Daily Cigarette Use: Indicators on Children and Youth" (Child Trends Data Bank, childtrends.org/wp-content/uploads/2012/11/03 _Smoking_new.pdf, retrieved April 17, 2017) included the accompanying data on the percentage of students who report smoking cigarettes daily, for students in grades 8, 10, and 12. Construct a time series plot for students in grade 12, and comment on any trend over time. Construct a time series plot that shows trends over time for each of the three grade levels. Graph each of the three-time series on the same set of axes, using different colors to distinguish the different grade levels. Either label the time series in the plot or include a legend to indicate which time series corresponds to which grade level. Write a paragraph based on the plot from Part (b). Discuss the similarities and differences for the three grade levelsin what year was NHS PPP seen to be most effective same for sugar tax and phsycial and healthy eating campains. on type 2 diabetes , provide a stastical graph along side raw data for eachThe following graphs are the results of the Statistical Process Control (SPC). Are they classified as in-control or not?
- An economist at Nedbank ran a study of the relationship between FTSE/JSE All Shares index return (JALSH) and consumer price index (CPI) from 2006 to 2017, the data collected is shown in the Table 1 below. FTSE/JSE All Shares index return (JALSH) and consumer price index (CPI) from 2006 to 2017. Year JALSH (Y) CPI (X) 2006 0.41 4.7 2007 0.19 7.1 2008 -0.23 11.5 2009 0.32 7.1 2010 0.19 4.3 2011 0.03 5.0 2012 0.27 5.6 2013 0.21 5.7 2014 0.11 6.1 2015 0.05 4.6 2016 0.00 6.4 2017 0.21 5.3 The estimated regression…This is from a recent news article about a study on children using drugs: “The researchers analyzed the data to estimate the average age at first-time use for 18 internationally regulated drugs for each year included in the study. Looking at year-to-year trends, they found that the average age at first use had increased for 12 out of 18 drugs, including alcohol, cocaine, ecstasy, hallucinogens, heroin, inhalants, LSD, marijuana, stimulants, and tobacco products such as cigars, cigarettes and smokeless tobacco. For the other six drugs— crack cocaine, methamphetamines, opioids, PCP, sedatives, and tranquilizers—they found no statistically significant changes in the age at first use.” Write one or two sentences interpreting the bold finding at the end of the paragraphAre the data displayed in the graph above discrete or continuous? What is the level of measurement of the data? Are the data above time series or cross-sectional data? Examine the data for each race/ethnicity group. Do the data represent a stationary or nonstationary process? Do any of the race/ethnicity groups exhibit a decreasing trend? Do any of the race/ethnicity groups show a strictly increasing trend over the entire time period from 2000 to 2016?
- In a poll, a random sample of 2163 adults aged 18 and over was asked, “When you see an ad emphasizing that a product is made in your country, are you likely to buy it, less likely to buy it, or neither more nor less likely to buy it?”. The results of the survey are presented in the side by side graph.In a poll, a random sample of 2163 adults (aged 18 and over) was asked, "When you see an ad emphasizing that a product is made in your country, are you more likely to buy it, less likely to buy it, or neither more nor less likely to buy it?" The results of the survey are presented in the side-by-side graph. Complete parts (a) through (d) below. (a) What proportion of 18- to 34-year-old respondents are more likely to buy when made in their country? What proportion of 35- to 44-year-old respondents are more likely to buy when made in their country? The proportion of 18- to 34-year-old respondents is enter your response here. The proportion of 35- to 44-year-old respondents is enter your response here. Part 2 (b) What age group has the greatest proportion who are more likely to buy when made in their country? A. 55+ yrs B. 35-44 yrs C. 18-34 yrs D. 45-54 yrs Part 3 (c) Which age group has a majority of respondents who…The following data provides the monthly streaming bill for a random sample of 20 households along with the number of televisions in the household (TV), the number of people living in the household (People). and the number of years that household has been a streaming customer (Years). Which variable is the least significant?
