The following graph shows the aggregate demand (AD) and aggregate supply (AS) curves for the United States in 1941. Shift one of the curves on the following graph to illustrate the effect of increased U.S. government spending during World War II.
The following graph shows the aggregate demand (AD) and aggregate supply (AS) curves for the United States in 1941. Shift one of the curves on the following graph to illustrate the effect of increased U.S. government spending during World War II.

Chapter17: Inflation
Section: Chapter Questions
Problem 9SQ

Related questions
Question
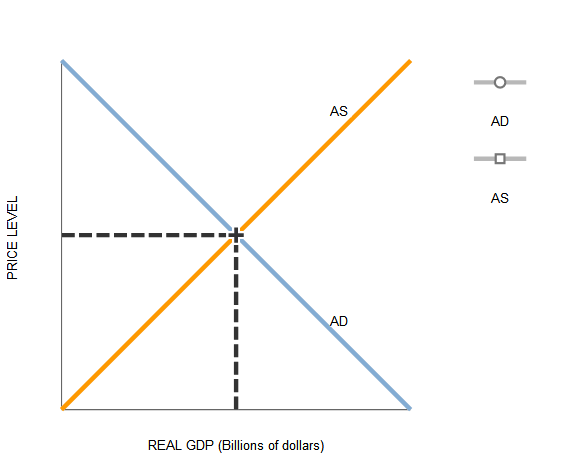
The following graph shows the aggregate demand (AD) and aggregate supply (AS) curves for the United States in 1941.
Shift one of the curves on the following graph to illustrate the effect of increased U.S. government spending during World War II.
Transcribed Image Text:AS
AD
AS
AD
REAL GDP (Billions of dollars)
PRICE LEVEL
Expert Solution
This question has been solved!
Explore an expertly crafted, step-by-step solution for a thorough understanding of key concepts.

This is a popular solution!

Trending now
This is a popular solution!

Step by step
Solved in 2 steps with 1 images

Knowledge Booster


Learn more about
Need a deep-dive on the concept behind this application? Look no further. Learn more about this topic, economics and related others by exploring similar questions and additional content below.Recommended textbooks for you

