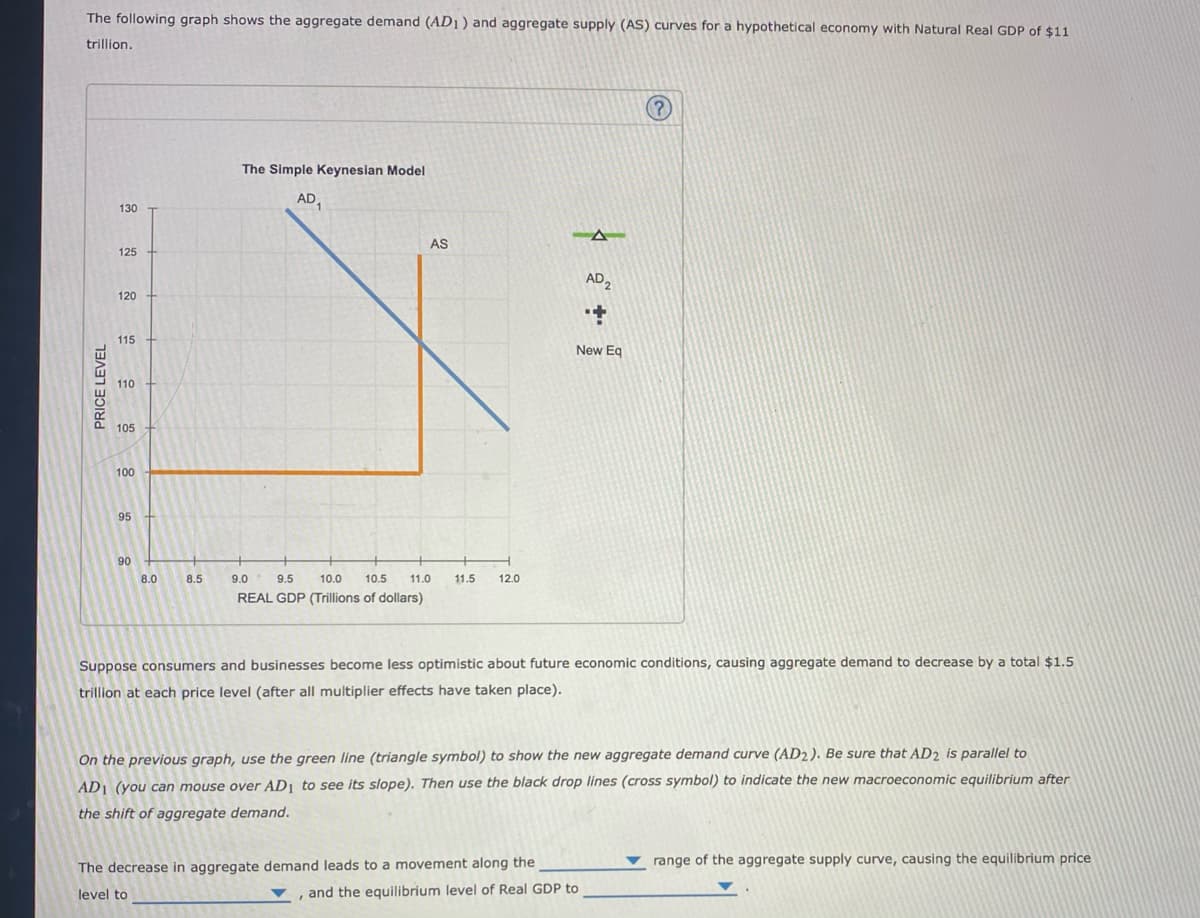
The following graph shows the aggregate demand (AD1) and aggregate supply (AS) curves for a hypothetical economy with Natural Real GDP of $11 trillion. PRICE LEVEL 130 125 120 115 110 105 The Simple Keynesian Model AD₁ AS A AD2 + New Eq
The following graph shows the aggregate demand (AD1) and aggregate supply (AS) curves for a hypothetical economy with Natural Real GDP of $11 trillion. PRICE LEVEL 130 125 120 115 110 105 The Simple Keynesian Model AD₁ AS A AD2 + New Eq

Macroeconomics: Principles and Policy (MindTap Course List)
13th Edition
ISBN:9781305280601
Author:William J. Baumol, Alan S. Blinder
Publisher:William J. Baumol, Alan S. Blinder
Chapter10: Bringing In The Supply Side: Unemployment And Inflation?
Section: Chapter Questions
Problem 3TY

Related questions
Question
Don’t know what to do or how to solve
Transcribed Image Text:The following graph shows the aggregate demand (AD1) and aggregate supply (AS) curves for a hypothetical economy with Natural Real GDP of $11
trillion.
PRICE LEVEL
130
125
120
115
110
105
100
95
90
8.0
8.5
The Simple Keynesian Model
AD
AS
9.0
9.5 10.0 10.5 11.0 11.5 12.0
REAL GDP (Trillions of dollars)
AD2
+
New Eq
Suppose consumers and businesses become less optimistic about future economic conditions, causing aggregate demand to decrease by a total $1.5
trillion at each price level (after all multiplier effects have taken place).
On the previous graph, use the green line (triangle symbol) to show the new aggregate demand curve (AD2). Be sure that AD2 is parallel to
AD1 (you can mouse over AD₁ to see its slope). Then use the black drop lines (cross symbol) to indicate the new macroeconomic equilibrium after
the shift of aggregate demand.
The decrease in aggregate demand leads to a movement along the
level to
, and the equilibrium level of Real GDP to
range of the aggregate supply curve, causing the equilibrium price
Expert Solution
This question has been solved!
Explore an expertly crafted, step-by-step solution for a thorough understanding of key concepts.

This is a popular solution!

Trending now
This is a popular solution!

Step by step
Solved in 2 steps with 1 images

Knowledge Booster


Learn more about
Need a deep-dive on the concept behind this application? Look no further. Learn more about this topic, economics and related others by exploring similar questions and additional content below.Recommended textbooks for you
Macroeconomics: Principles and Policy (MindTap Co…
Economics
ISBN:
9781305280601
Author:
William J. Baumol, Alan S. Blinder
Publisher:
Cengage Learning


Macroeconomics: Principles and Policy (MindTap Co…
Economics
ISBN:
9781305280601
Author:
William J. Baumol, Alan S. Blinder
Publisher:
Cengage Learning


Brief Principles of Macroeconomics (MindTap Cours…
Economics
ISBN:
9781337091985
Author:
N. Gregory Mankiw
Publisher:
Cengage Learning