The following graph shows the annual number of housing starts in a country during 2000–2008 together with the given quadratic approximating model. s(t) = −30t2 + 240t + 800 thousand homes per year (See attached graph) (t is the time in years since 2000.) At the same time, the homes being built were getting larger: The average area per home is approximately given by the following function. a(t) = 90t + 6,000 square feet Use the given models to estimate the total housing area under construction over the given period. (Use integration by parts to evaluate the integral, and round your answer to the nearest billion square feet.) HINT [Rate of change of area under construction = s(t)a(t).] ____________ billion square feet


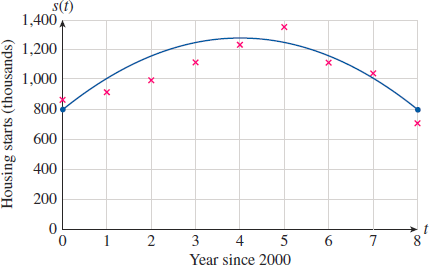
The following graph shows the annual number of housing starts in a country during 2000–2008 together with the given quadratic approximating model.
s(t) = −30t2 + 240t + 800 thousand homes per year (See attached graph)
(t is the time in years since 2000.) At the same time, the homes being built were getting larger: The average area per home is approximately given by the following function.
a(t) = 90t + 6,000 square feet
Use the given models to estimate the total housing area under construction over the given period. (Use
____________ billion square feet


Trending now
This is a popular solution!

Step by step
Solved in 2 steps with 2 images


