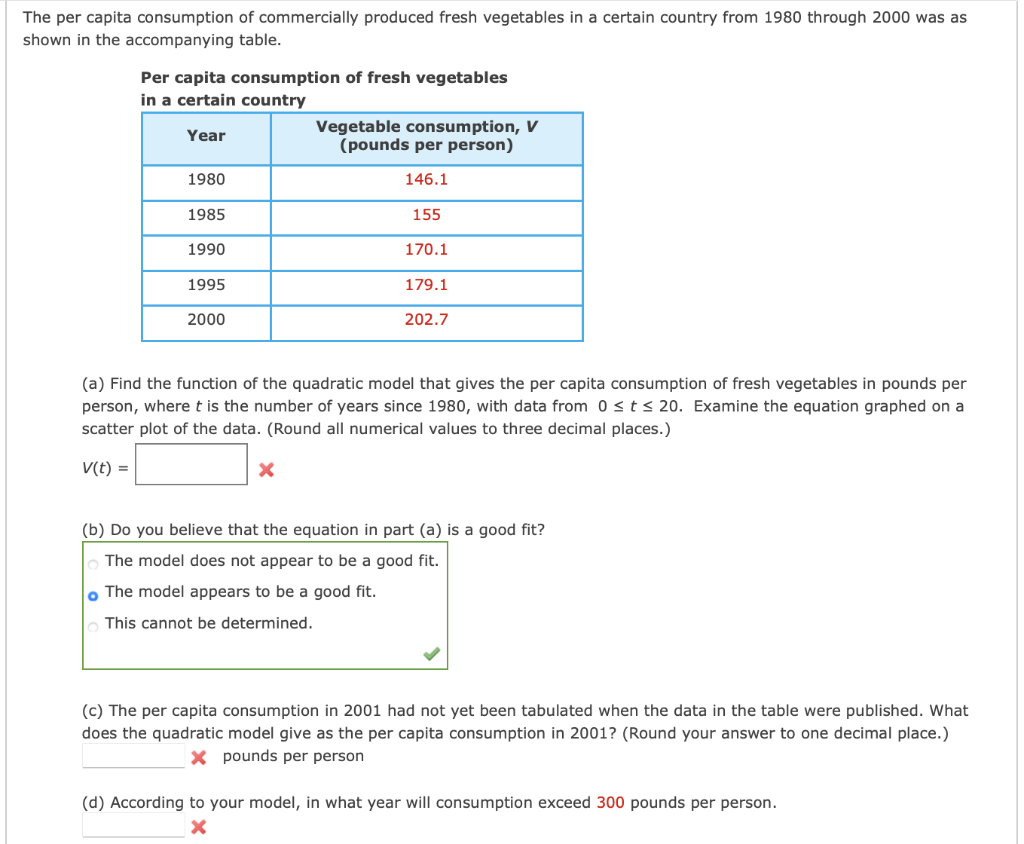
The per capita consumption of commercially produced fresh vegetables in a certain country from 1980 through 2000 was as shown in the accompanying table. Per capita consumption of fresh vegetables in a certain country Vegetable consumption, V (pounds per person) Year 1980 146.1 1985 155 1990 170.1 1995 179.1 2000 202.7 (a) Find the function of the quadratic model that gives the per capita consumption of fresh vegetables in pounds per person, where t is the number of years since 1980, with data from 0 < t < 20. Examine the equation graphed on a scatter plot of the data. (Round all numerical values to three decimal places.) V(t) = (b) Do you believe that the equation in part (a) is a good fit? The model does not appear to be a good fit. o The model appears to be a good fit. This cannot be determined. (c) The per capita consumption in 2001 had not yet been tabulated when the data in the table were published. What does the quadratic model give as the per capita consumption in 2001? (Round your answer to one decimal place.) X pounds per person (d) According to your model, in what year will consumption exceed 300 pounds per person.
The per capita consumption of commercially produced fresh vegetables in a certain country from 1980 through 2000 was as shown in the accompanying table. Per capita consumption of fresh vegetables in a certain country Vegetable consumption, V (pounds per person) Year 1980 146.1 1985 155 1990 170.1 1995 179.1 2000 202.7 (a) Find the function of the quadratic model that gives the per capita consumption of fresh vegetables in pounds per person, where t is the number of years since 1980, with data from 0 < t < 20. Examine the equation graphed on a scatter plot of the data. (Round all numerical values to three decimal places.) V(t) = (b) Do you believe that the equation in part (a) is a good fit? The model does not appear to be a good fit. o The model appears to be a good fit. This cannot be determined. (c) The per capita consumption in 2001 had not yet been tabulated when the data in the table were published. What does the quadratic model give as the per capita consumption in 2001? (Round your answer to one decimal place.) X pounds per person (d) According to your model, in what year will consumption exceed 300 pounds per person.

Functions and Change: A Modeling Approach to College Algebra (MindTap Course List)
6th Edition
ISBN:9781337111348
Author:Bruce Crauder, Benny Evans, Alan Noell
Publisher:Bruce Crauder, Benny Evans, Alan Noell
Chapter5: A Survey Of Other Common Functions
Section5.5: Quadratic Functions
Problem 3TU: TEST FOR UNDERSTANDING FOR EXAMPLE 5.16 In the study Economics of Scale in High School Operation by...

Related questions

Concept explainers
Contingency Table
A contingency table can be defined as the visual representation of the relationship between two or more categorical variables that can be evaluated and registered. It is a categorical version of the scatterplot, which is used to investigate the linear relationship between two variables. A contingency table is indeed a type of frequency distribution table that displays two variables at the same time.
Binomial Distribution
Binomial is an algebraic expression of the sum or the difference of two terms. Before knowing about binomial distribution, we must know about the binomial theorem.
Topic Video
Question
6
Transcribed Image Text:The per capita consumption of commercially produced fresh vegetables in a certain country from 1980 through 2000 was as
shown in the accompanying table.
Per capita consumption of fresh vegetables
in a certain country
Vegetable consumption, V
(pounds per person)
Year
1980
146.1
1985
155
1990
170.1
1995
179.1
2000
202.7
(a) Find the function of the quadratic model that gives the per capita consumption of fresh vegetables in pounds per
person, wheret is the number of years since 1980, with data from 0 sts 20. Examine the equation graphed on a
scatter plot of the data. (Round all numerical values to three decimal places.)
V(t) =
(b) Do you believe that the equation in part (a) is a good fit?
O The model does not appear to be a good fit.
lo The model appears to be a good fit.
O This cannot be determined.
(c) The per capita consumption in 2001 had not yet been tabulated when the data in the table were published. What
does the quadratic model give as the per capita consumption in 2001? (Round your answer to one decimal place.)
X pounds per person
(d) According to your model, in what year will consumption exceed 300 pounds per person.
Expert Solution
This question has been solved!
Explore an expertly crafted, step-by-step solution for a thorough understanding of key concepts.

This is a popular solution!

Trending now
This is a popular solution!

Step by step
Solved in 4 steps with 1 images

Knowledge Booster


Learn more about
Need a deep-dive on the concept behind this application? Look no further. Learn more about this topic, statistics and related others by exploring similar questions and additional content below.Recommended textbooks for you
Functions and Change: A Modeling Approach to Coll…
Algebra
ISBN:
9781337111348
Author:
Bruce Crauder, Benny Evans, Alan Noell
Publisher:
Cengage Learning

College Algebra (MindTap Course List)
Algebra
ISBN:
9781305652231
Author:
R. David Gustafson, Jeff Hughes
Publisher:
Cengage Learning

Algebra & Trigonometry with Analytic Geometry
Algebra
ISBN:
9781133382119
Author:
Swokowski
Publisher:
Cengage
Functions and Change: A Modeling Approach to Coll…
Algebra
ISBN:
9781337111348
Author:
Bruce Crauder, Benny Evans, Alan Noell
Publisher:
Cengage Learning
College Algebra (MindTap Course List)
Algebra
ISBN:
9781305652231
Author:
R. David Gustafson, Jeff Hughes
Publisher:
Cengage Learning
Algebra & Trigonometry with Analytic Geometry
Algebra
ISBN:
9781133382119
Author:
Swokowski
Publisher:
Cengage
