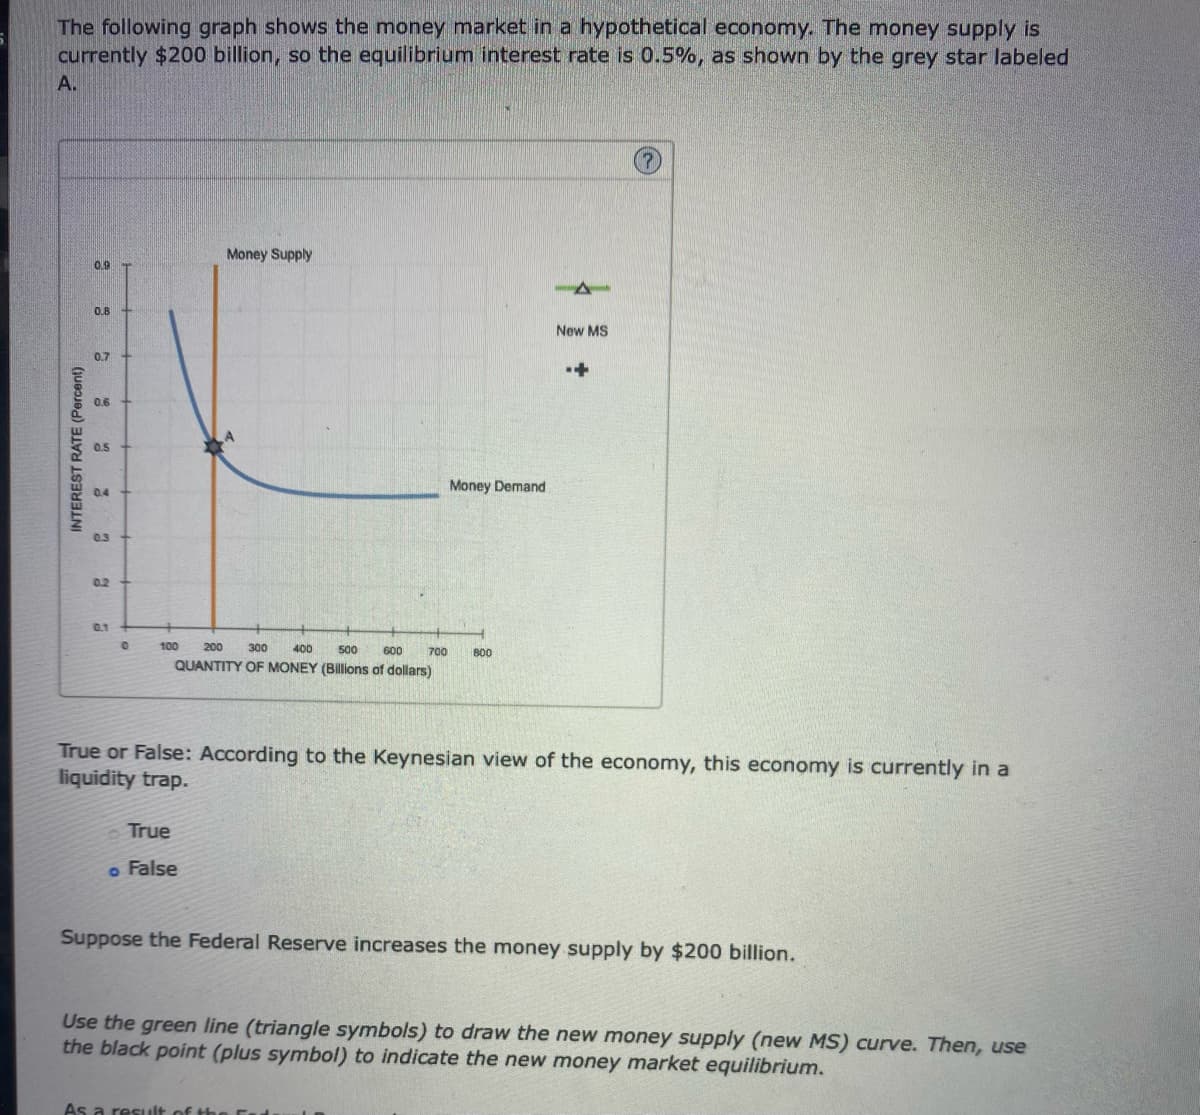
The following graph shows the money market in a hypothetical economy. The money supply is currently $200 billion, so the equilibrium interest rate is 0.5%, as shown by the grey star labeled A. INTEREST RATE (Percent) 0.9 0.8 0.7 0.6 0.5 04 0.3 0.2 0.1 0 100 Money Supply 200 300 400 500 600 QUANTITY OF MONEY (Billions of dollars) True o False 700 Money Demand 800 New MS + True or False: According to the Keynesian view of the economy, this economy is currently in a liquidity trap. Suppose the Federal Reserve increases the money supply by $200 billion. Use the green line (triangle symbols) to draw the new money supply (new MS) curve. Then, use the black point (plus symbol) to indicate the new money market equilibrium,
The following graph shows the money market in a hypothetical economy. The money supply is currently $200 billion, so the equilibrium interest rate is 0.5%, as shown by the grey star labeled A. INTEREST RATE (Percent) 0.9 0.8 0.7 0.6 0.5 04 0.3 0.2 0.1 0 100 Money Supply 200 300 400 500 600 QUANTITY OF MONEY (Billions of dollars) True o False 700 Money Demand 800 New MS + True or False: According to the Keynesian view of the economy, this economy is currently in a liquidity trap. Suppose the Federal Reserve increases the money supply by $200 billion. Use the green line (triangle symbols) to draw the new money supply (new MS) curve. Then, use the black point (plus symbol) to indicate the new money market equilibrium,

Essentials of Economics (MindTap Course List)
8th Edition
ISBN:9781337091992
Author:N. Gregory Mankiw
Publisher:N. Gregory Mankiw
Chapter24: The Influence Of Monetary And Fiscal Policy On Aggregate Demand
Section: Chapter Questions
Problem 1PA

Related questions
Question
Confused on what to do for the graphs
Transcribed Image Text:The following graph shows the money market in a hypothetical economy. The money supply is
currently $200 billion, so the equilibrium interest rate is 0.5%, as shown by the grey star labeled
A.
INTEREST RATE (Percent)
0.9
0.8
0.7
0.6
0.5
0.4
0.3
0.2
0.1
0
100
Money Supply
200
300 400 500
600
QUANTITY OF MONEY (Billions of dollars)
True
o False
Money Demand
700 800
True or False: According to the Keynesian view of the economy, this economy is currently in a
liquidity trap.
New MS
As a result of the F
Suppose the Federal Reserve increases the money supply by $200 billion.
Use the green line (triangle symbols) to draw the new money supply (new MS) curve. Then, use
the black point (plus symbol) to indicate the new money market equilibrium.
Transcribed Image Text:Suppose the Federal Reserve increases the money supply by $200 billion.
Use the green line (triangle symbols) to draw the new money supply (new MS) curve. Then, use
the black point (plus symbol) to indicate the new money market equilibrium.
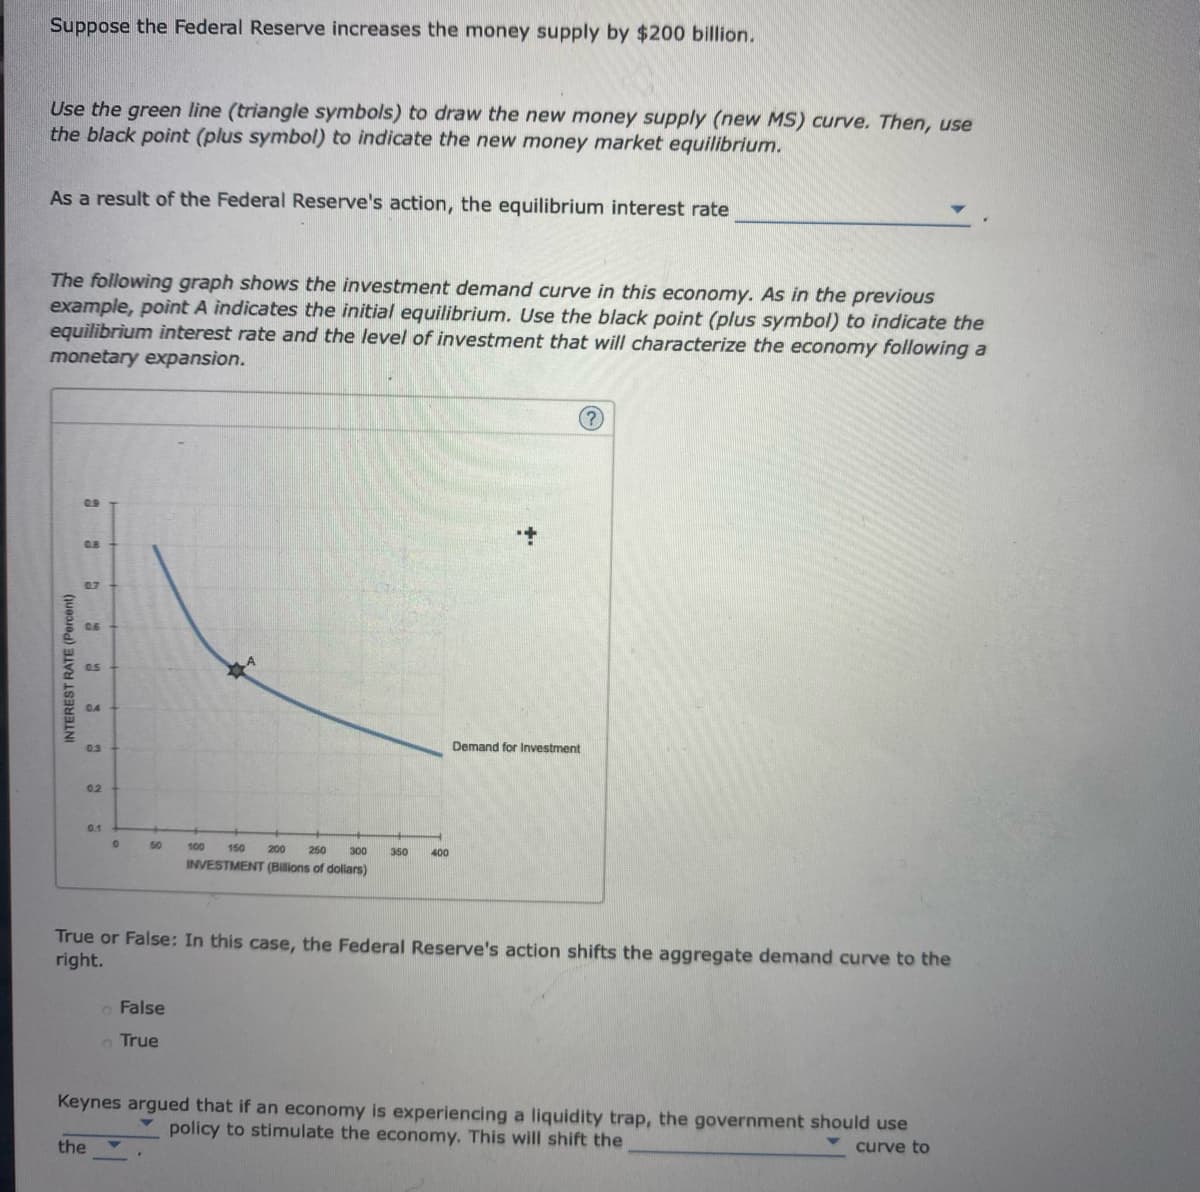
As a result of the Federal Reserve's action, the equilibrium interest rate
The following graph shows the investment demand curve in this economy. As in the previous
example, point A indicates the initial equilibrium. Use the black point (plus symbol) to indicate the
equilibrium interest rate and the level of investment that will characterize the economy following a
monetary expansion.
INTEREST RATE (Percent)
0.3
0.2
0.1
50
the
100
150
200
250
INVESTMENT (Billions of dollars)
False
True
300 350 400
Demand for Investment
True or False: In this case, the Federal Reserve's action shifts the aggregate demand curve to the
right.
?
Keynes argued that if an economy is experiencing a liquidity trap, the government should use
policy to stimulate the economy. This will shift the
curve to
Expert Solution
This question has been solved!
Explore an expertly crafted, step-by-step solution for a thorough understanding of key concepts.

This is a popular solution!

Trending now
This is a popular solution!

Step by step
Solved in 3 steps with 2 images

Knowledge Booster


Learn more about
Need a deep-dive on the concept behind this application? Look no further. Learn more about this topic, economics and related others by exploring similar questions and additional content below.Recommended textbooks for you
Essentials of Economics (MindTap Course List)
Economics
ISBN:
9781337091992
Author:
N. Gregory Mankiw
Publisher:
Cengage Learning

Brief Principles of Macroeconomics (MindTap Cours…
Economics
ISBN:
9781337091985
Author:
N. Gregory Mankiw
Publisher:
Cengage Learning

Exploring Economics
Economics
ISBN:
9781544336329
Author:
Robert L. Sexton
Publisher:
SAGE Publications, Inc
Essentials of Economics (MindTap Course List)
Economics
ISBN:
9781337091992
Author:
N. Gregory Mankiw
Publisher:
Cengage Learning
Brief Principles of Macroeconomics (MindTap Cours…
Economics
ISBN:
9781337091985
Author:
N. Gregory Mankiw
Publisher:
Cengage Learning
Exploring Economics
Economics
ISBN:
9781544336329
Author:
Robert L. Sexton
Publisher:
SAGE Publications, Inc

Macroeconomics: Private and Public Choice (MindTa…
Economics
ISBN:
9781305506756
Author:
James D. Gwartney, Richard L. Stroup, Russell S. Sobel, David A. Macpherson
Publisher:
Cengage Learning

Economics: Private and Public Choice (MindTap Cou…
Economics
ISBN:
9781305506725
Author:
James D. Gwartney, Richard L. Stroup, Russell S. Sobel, David A. Macpherson
Publisher:
Cengage Learning
