The following graph shows the monthly demand and supply curves in the market for shirts. The equilibrium price in this market is $_________ per shirt, and the equilibrium quantity is ______ shirts bought and sold per month. Complete the following table by indicating at each price whether there is a shortage or surplus in the market, the amount of that shortage or surplus, and whether this places upward or downward pressure on prices. Pressure on price options for table: downward, upward
The following graph shows the monthly demand and supply curves in the market for shirts. The equilibrium price in this market is $_________ per shirt, and the equilibrium quantity is ______ shirts bought and sold per month. Complete the following table by indicating at each price whether there is a shortage or surplus in the market, the amount of that shortage or surplus, and whether this places upward or downward pressure on prices. Pressure on price options for table: downward, upward

Chapter4: Prices: Free, Controlled, And Relative
Section4.2: Price Controls
Problem 2ST

Related questions
Question
The following graph shows the monthly demand and supply curves in the market for shirts.
The equilibrium price in this market is $_________ per shirt, and the equilibrium quantity is ______ shirts bought and sold per month.
Complete the following table by indicating at each price whether there is a shortage or surplus in the market, the amount of that shortage or surplus, and whether this places upward or downward pressure on prices.
Pressure on price options for table: downward, upward
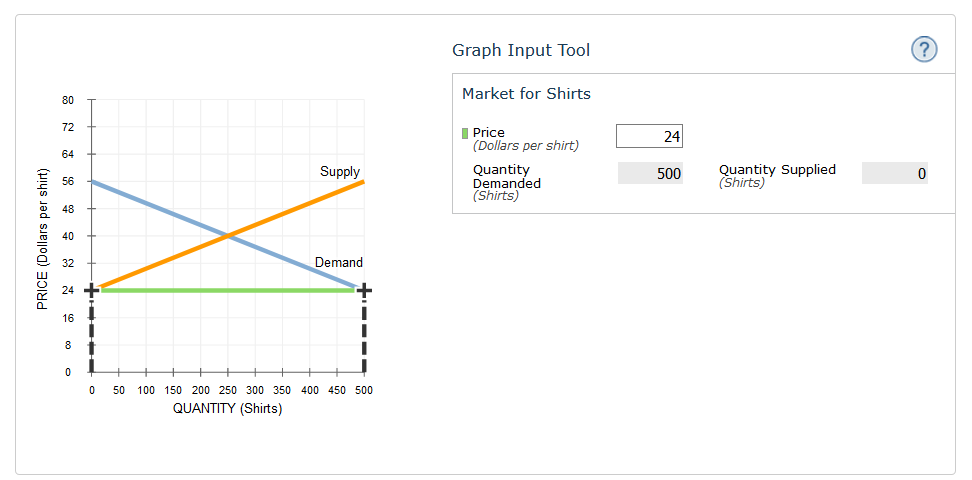
Transcribed Image Text:Graph Input Tool
Market for Shirts
80
72
I Price
(Dollars per shirt)
24
64
Quantity
Demanded
(Shirts)
Quantity Supplied
(Shirts)
Supply
500
56
40
32
Demand
24 +
16
8
50 100 150 200 250 300 350 400 450 500
QUANTITY (Shirts)
PRICE (Dollars per shirt)
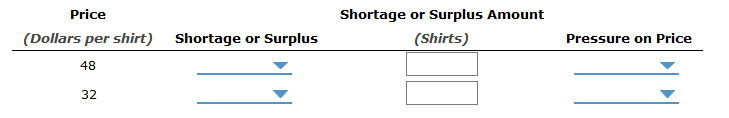
Transcribed Image Text:Price
Shortage
Surplus Amount
or
(Dollars per shirt) Shortage or Surplus
(Shirts)
Pressure on Price
48
32
Expert Solution
Step 1
Demand represents the volume of goods and services that the consumers are willing to purchase at different prices in the market. Supply represents the volume of goods and services that the producers are willing to sell at different prices in the market. At the point of equilibrium, demand and supply are in balance.

Trending now
This is a popular solution!

Step by step
Solved in 3 steps

Knowledge Booster


Learn more about
Need a deep-dive on the concept behind this application? Look no further. Learn more about this topic, economics and related others by exploring similar questions and additional content below.Recommended textbooks for you


Economics (MindTap Course List)
Economics
ISBN:
9781337617383
Author:
Roger A. Arnold
Publisher:
Cengage Learning
Economics (MindTap Course List)
Economics
ISBN:
9781337617383
Author:
Roger A. Arnold
Publisher:
Cengage Learning


