The following graph shows the short-run average total cost curves and the long-run average cost curve for a publishing firm. The five marked quantities indicate points of tangency between each short-run average total cost curve (SRATC) and the long-run average cost curve (LRAC); for example, Q1 marks the point of tangency between SRATC, and LRAC. The orange point on SRATC3 indicates the firm's current output level in the short run (Q3). SRATC, SRATC5 LRAC SRATC, SRATC3 SRATC4 QUANTITY OF OUTPUIT COST PER UNIT
The following graph shows the short-run average total cost curves and the long-run average cost curve for a publishing firm. The five marked quantities indicate points of tangency between each short-run average total cost curve (SRATC) and the long-run average cost curve (LRAC); for example, Q1 marks the point of tangency between SRATC, and LRAC. The orange point on SRATC3 indicates the firm's current output level in the short run (Q3). SRATC, SRATC5 LRAC SRATC, SRATC3 SRATC4 QUANTITY OF OUTPUIT COST PER UNIT

Chapter11: The Firm: Production And Costs
Section: Chapter Questions
Problem 17P

Related questions

Question
Urgently need
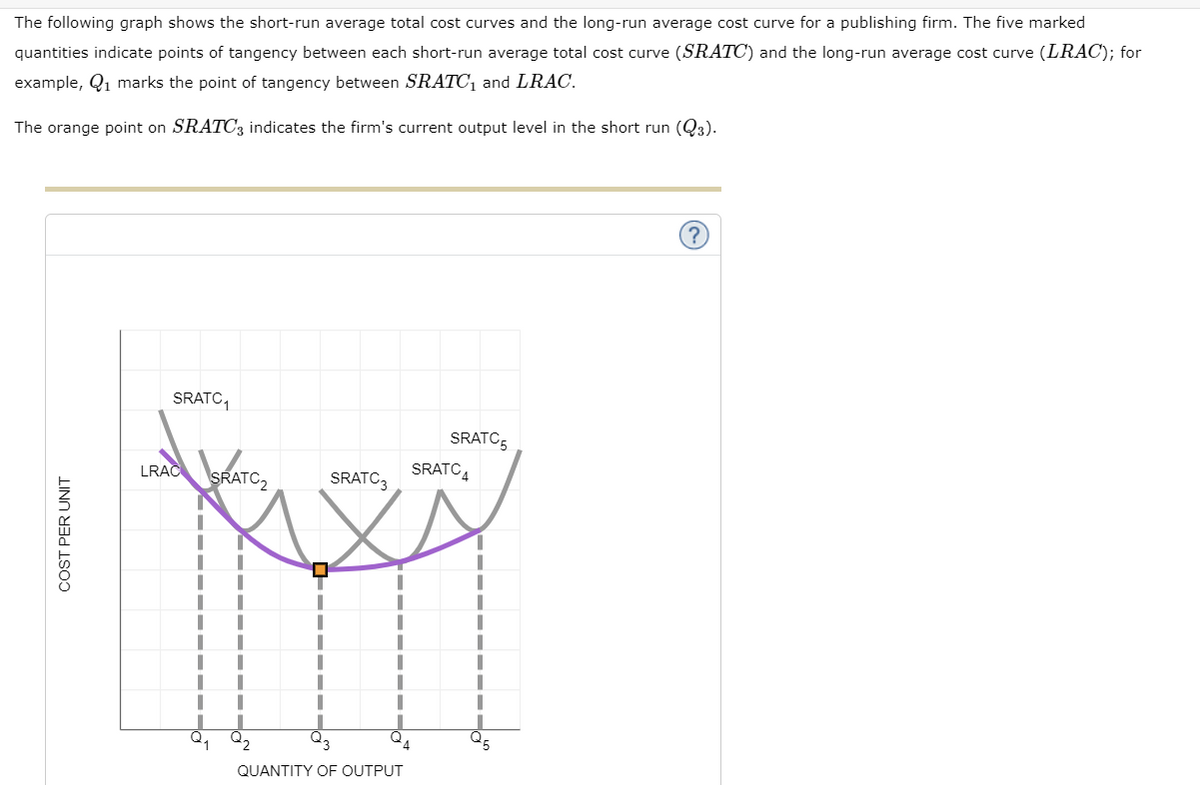
Transcribed Image Text:The following graph shows the short-run average total cost curves and the long-run average cost curve for a publishing firm. The five marked
quantities indicate points of tangency between each short-run average total cost curve (SRATC) and the long-run average cost curve (LRAC); for
example, Q1 marks the point of tangency between SRATC, and LRAC.
The orange point on SRATC3 indicates the firm's current output level in the short run (Q3).
?
SRATC,
SRATC5
LRAC
SRATC,
SRATC3
SRATC4
21
QUANTITY OF OUTPUT
COST PER UNIT
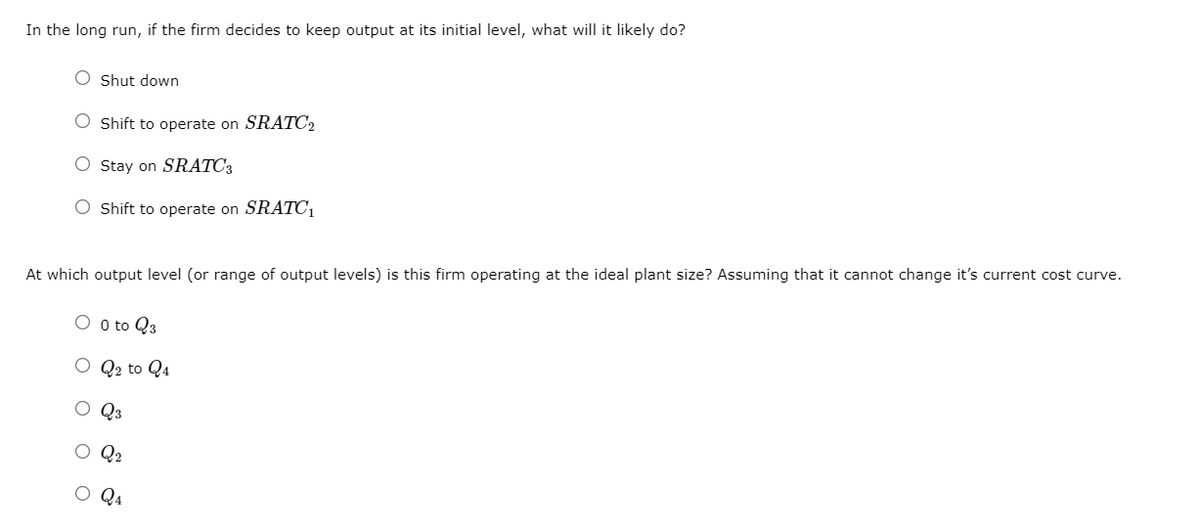
Transcribed Image Text:In the long run, if the firm decides to keep output at its initial level, what will it likely do?
O Shut down
O Shift to operate on SRATC2
O Stay on SRATC3
O Shift to operate on SRATC1
At which output level (or range of output levels) is this firm operating at the ideal plant size? Assuming that it cannot change it's current cost curve.
O o to Q3
O Q2 to Q4
O Q3
O Q2
O Q4
Expert Solution
This question has been solved!
Explore an expertly crafted, step-by-step solution for a thorough understanding of key concepts.

This is a popular solution!

Trending now
This is a popular solution!

Step by step
Solved in 2 steps with 1 images

Knowledge Booster


Learn more about
Need a deep-dive on the concept behind this application? Look no further. Learn more about this topic, economics and related others by exploring similar questions and additional content below.Recommended textbooks for you
Exploring Economics
Economics
ISBN:
9781544336329
Author:
Robert L. Sexton
Publisher:
SAGE Publications, Inc


Exploring Economics
Economics
ISBN:
9781544336329
Author:
Robert L. Sexton
Publisher:
SAGE Publications, Inc

