The following histogram shows the distribution of 1000 sample observations from a population with a mean of u=4 and a variance of o = 8. 10 Suppose a simple random sample of 100 observations is to be selected from the population and the sample average x is calculated. Which of the following statements about the distribution of x is/are FALSE? A) The distribution of x will have a mean of 4. B) The distribution x will be approximately Normal. C) Because the distribution shown in the histogram above is clearly skewed to the right, the shape of the distribution of x will also show skewness to the right. D) Even though the distribution of the population variable appears to be skewed to the right, the distribution of F will be approximately symmetric around u= 4. E) The standard deviation of the distribution of x will be 0.283.
The following histogram shows the distribution of 1000 sample observations from a population with a mean of u=4 and a variance of o = 8. 10 Suppose a simple random sample of 100 observations is to be selected from the population and the sample average x is calculated. Which of the following statements about the distribution of x is/are FALSE? A) The distribution of x will have a mean of 4. B) The distribution x will be approximately Normal. C) Because the distribution shown in the histogram above is clearly skewed to the right, the shape of the distribution of x will also show skewness to the right. D) Even though the distribution of the population variable appears to be skewed to the right, the distribution of F will be approximately symmetric around u= 4. E) The standard deviation of the distribution of x will be 0.283.

Glencoe Algebra 1, Student Edition, 9780079039897, 0079039898, 2018
18th Edition
ISBN:9780079039897
Author:Carter
Publisher:Carter
Chapter10: Statistics
Section10.4: Distributions Of Data
Problem 19PFA

Related questions
Question
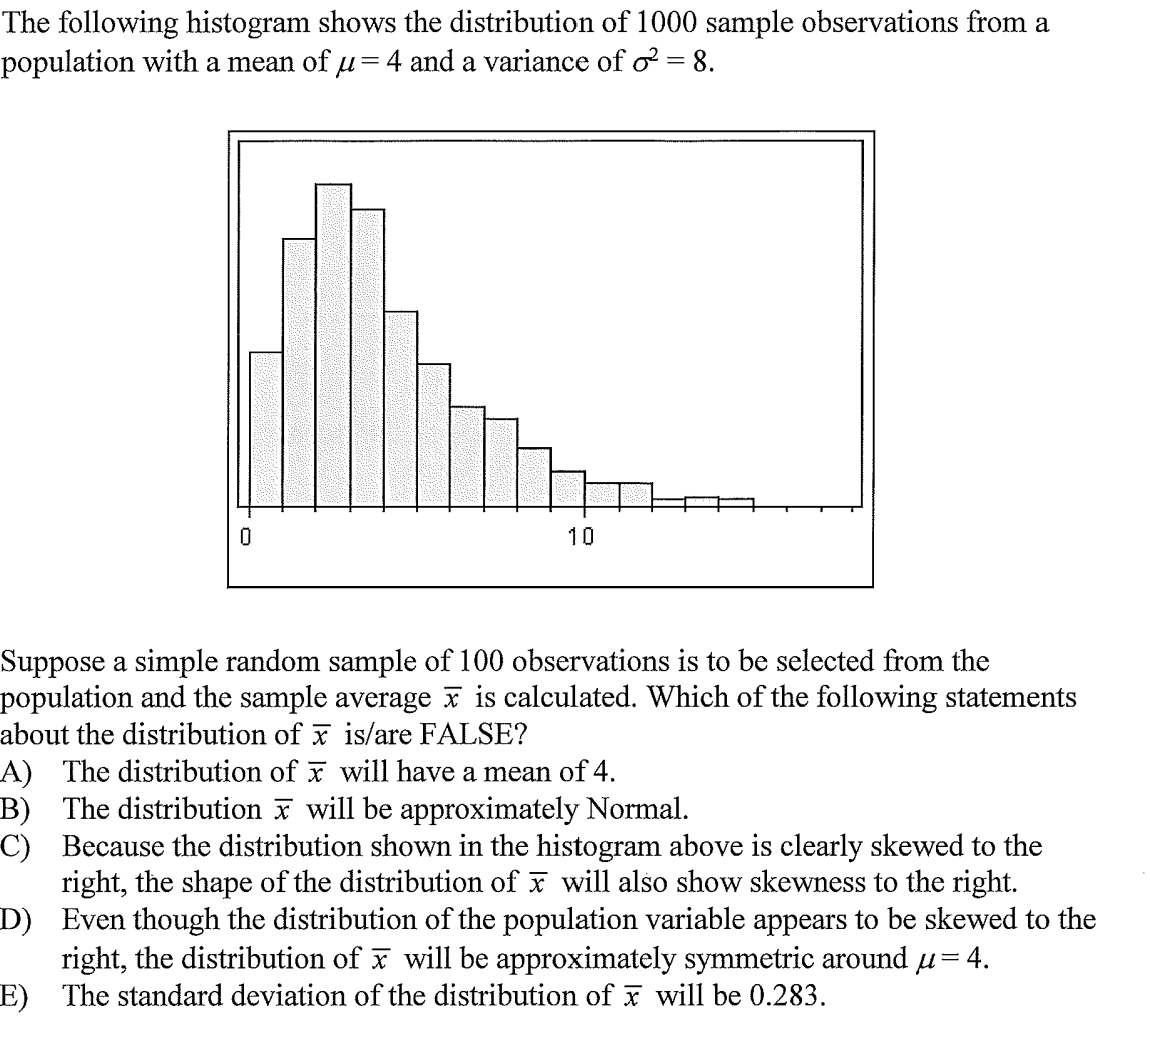
Transcribed Image Text:The following histogram shows the distribution of 1000 sample observations from a
population with a mean of u=4 and a variance of o = 8.
10
Suppose a simple random sample of 100 observations is to be selected from the
population and the sample average x is calculated. Which of the following statements
about the distribution of is/are FALSE?
A) The distribution of x will have a mean of 4.
B) The distribution x will be approximately Normal.
C) Because the distribution shown in the histogram above is clearly skewed to the
right, the shape of the distribution of x will also show skewness to the right.
D) Even though the distribution of the population variable appears to be skewed to the
right, the distribution of x will be approximately symmetric around u= 4.
E) The standard deviation of the distribution of x will be 0.283.
Expert Solution
This question has been solved!
Explore an expertly crafted, step-by-step solution for a thorough understanding of key concepts.

This is a popular solution!

Trending now
This is a popular solution!

Step by step
Solved in 2 steps

Recommended textbooks for you
Glencoe Algebra 1, Student Edition, 9780079039897…
Algebra
ISBN:
9780079039897
Author:
Carter
Publisher:
McGraw Hill
Glencoe Algebra 1, Student Edition, 9780079039897…
Algebra
ISBN:
9780079039897
Author:
Carter
Publisher:
McGraw Hill