Use the data as given in the problem and answer the following questions. The data shows the opening bid for an auction item and the winning bid for the same item. UPLOAD YOUR RESPONSE. Paired Data x (opening bid) 10 4 y (winning bid) 50 17 23 28 13 11 Make sure to answer each question. 1. Create a scatter plot of your data. (I suggest that the y-axis should range from 0 to 70 in increments of 10 and the x-axis should start from 0 and go to 10 in increments of 1) 2. Find correlation coefficientr (Round to three digits.) 3. Use the Critical Value for Correlation Coefficient Table to determine if there is evidence for a linear correlation. Assume a = 0.05. (Write down the critical value from the table and answer yes %3D or no) 2) 3.
Use the data as given in the problem and answer the following questions. The data shows the opening bid for an auction item and the winning bid for the same item. UPLOAD YOUR RESPONSE. Paired Data x (opening bid) 10 4 y (winning bid) 50 17 23 28 13 11 Make sure to answer each question. 1. Create a scatter plot of your data. (I suggest that the y-axis should range from 0 to 70 in increments of 10 and the x-axis should start from 0 and go to 10 in increments of 1) 2. Find correlation coefficientr (Round to three digits.) 3. Use the Critical Value for Correlation Coefficient Table to determine if there is evidence for a linear correlation. Assume a = 0.05. (Write down the critical value from the table and answer yes %3D or no) 2) 3.

Algebra & Trigonometry with Analytic Geometry
13th Edition
ISBN:9781133382119
Author:Swokowski
Publisher:Swokowski
Chapter7: Analytic Trigonometry
Section7.6: The Inverse Trigonometric Functions
Problem 94E

Related questions
Question
Help please
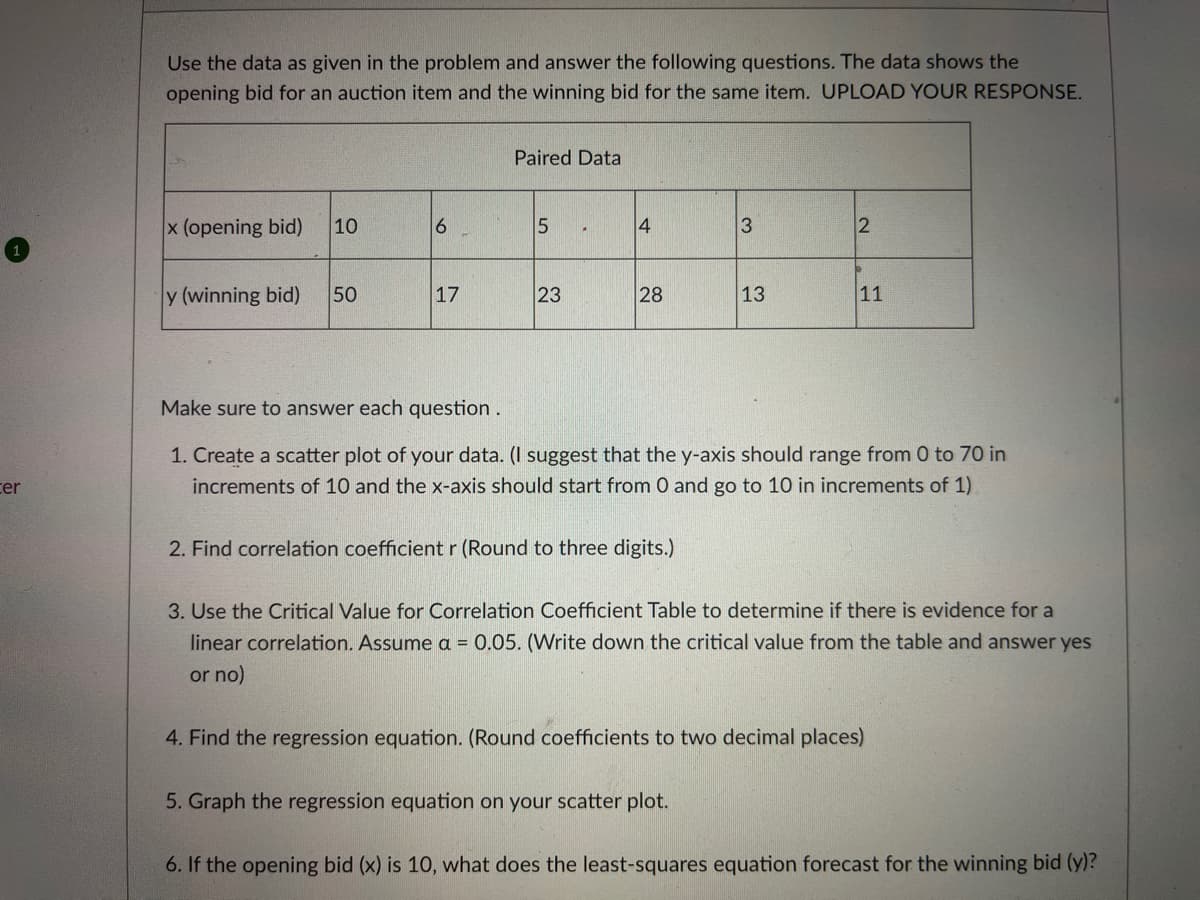
Transcribed Image Text:Use the data as given in the problem and answer the following questions. The data shows the
opening bid for an auction item and the winning bid for the same item. UPLOAD YOUR RESPONSE.
Paired Data
x (opening bid)
10
14
3
y (winning bid)
50
17
28
13
11
Make sure to answer each question.
1. Create a scatter plot of your data. (I suggest that the y-axis should range from 0 to 70 in
cer
increments of 10 and the x-axis should start from 0 and go to 10 in increments of 1)
2. Find correlation coefficientr (Round to three digits.)
3. Use the Critical Value for Correlation Coefficient Table to determine if there is evidence for a
linear correlation. Assume a = 0.05. (Write down the critical value from the table and answer yes
or no)
4. Find the regression equation. (Round coefficients to two decimal places)
5. Graph the regression equation on your scatter plot.
6. If the opening bid (x) is 10, what does the least-squares equation forecast for the winning bid (y)?
23
Expert Solution
This question has been solved!
Explore an expertly crafted, step-by-step solution for a thorough understanding of key concepts.

Step by step
Solved in 4 steps with 1 images

Recommended textbooks for you
Algebra & Trigonometry with Analytic Geometry
Algebra
ISBN:
9781133382119
Author:
Swokowski
Publisher:
Cengage

Glencoe Algebra 1, Student Edition, 9780079039897…
Algebra
ISBN:
9780079039897
Author:
Carter
Publisher:
McGraw Hill

Functions and Change: A Modeling Approach to Coll…
Algebra
ISBN:
9781337111348
Author:
Bruce Crauder, Benny Evans, Alan Noell
Publisher:
Cengage Learning
Algebra & Trigonometry with Analytic Geometry
Algebra
ISBN:
9781133382119
Author:
Swokowski
Publisher:
Cengage
Glencoe Algebra 1, Student Edition, 9780079039897…
Algebra
ISBN:
9780079039897
Author:
Carter
Publisher:
McGraw Hill
Functions and Change: A Modeling Approach to Coll…
Algebra
ISBN:
9781337111348
Author:
Bruce Crauder, Benny Evans, Alan Noell
Publisher:
Cengage Learning

College Algebra
Algebra
ISBN:
9781305115545
Author:
James Stewart, Lothar Redlin, Saleem Watson
Publisher:
Cengage Learning

Holt Mcdougal Larson Pre-algebra: Student Edition…
Algebra
ISBN:
9780547587776
Author:
HOLT MCDOUGAL
Publisher:
HOLT MCDOUGAL