The following information is available for a country: Saving Function: S-200 0.4Y Investment Function: 1- 200 The graphs of the saving and investment functions are shown as S, and I respectively 1) Using the point drawing tool, identify the original equilibrium point Label it E Now, suppose all individuals have become more thrifty. For every level of income they plan to save an additional $200. 2) Using the line drawing tool draw the new saving function and label & S 3) Using the point drawing tool identify the new equilibrium point and label it F Note Carefully follow the instructione above and only i the required objects Saving and Investment 000 500 400- 300- 200 100 -100- 296 300 400 1000 Aggregate Output/income S₁ 1500 ROC
The following information is available for a country: Saving Function: S-200 0.4Y Investment Function: 1- 200 The graphs of the saving and investment functions are shown as S, and I respectively 1) Using the point drawing tool, identify the original equilibrium point Label it E Now, suppose all individuals have become more thrifty. For every level of income they plan to save an additional $200. 2) Using the line drawing tool draw the new saving function and label & S 3) Using the point drawing tool identify the new equilibrium point and label it F Note Carefully follow the instructione above and only i the required objects Saving and Investment 000 500 400- 300- 200 100 -100- 296 300 400 1000 Aggregate Output/income S₁ 1500 ROC

Chapter11: Managing Aggregate Demand: Fiscal Policy
Section: Chapter Questions
Problem 2TY

Related questions
Question
9
Transcribed Image Text:K
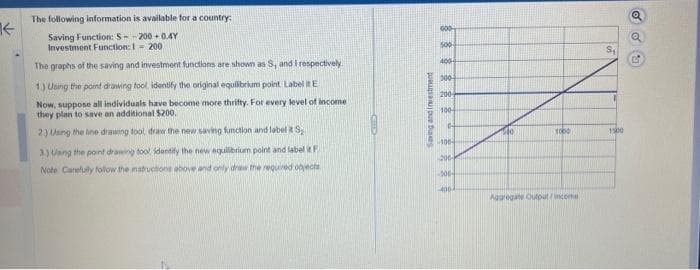
The following information is available for a country:
Saving Function: S--200-0.4Y
Investment Function: 1 2001
The graphs of the saving and investment functions are shown as S, and I respectively
1) Using the point drawing tool, identify the original equilibrium point. Label it E
Now, suppose all individuals have become more thrifty. For every level of income
they plan to save an additional $200.
2) Using the line drawing tool draw the new saving function and label & S
3) Using the point drawing tool identify the new equilibrium point and label it F
Note: Carefully follow the instructions above and only draw the required objects
Saving and Investment
600-
500
400-
300
200-
100
0-
100-
200
300-
4004
1000
Aggregate Output/income
S₁
1500
o ou
Expert Solution
This question has been solved!
Explore an expertly crafted, step-by-step solution for a thorough understanding of key concepts.

Step by step
Solved in 2 steps with 3 images

Knowledge Booster


Learn more about
Need a deep-dive on the concept behind this application? Look no further. Learn more about this topic, economics and related others by exploring similar questions and additional content below.Recommended textbooks for you

