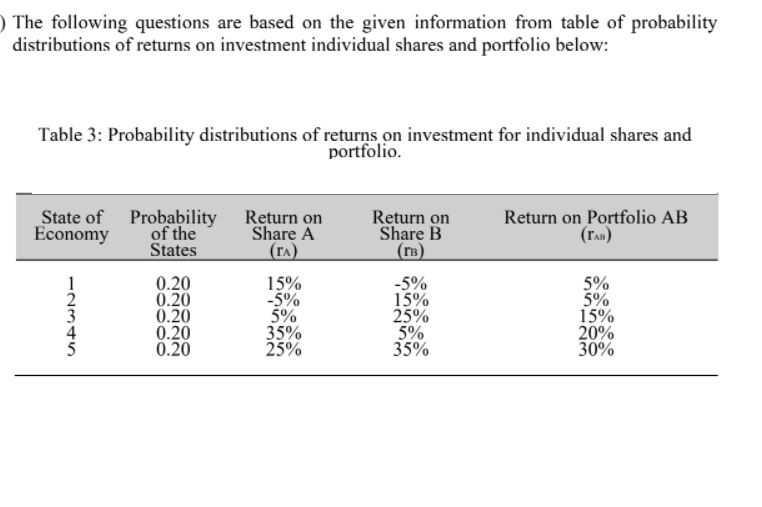
The following questions are based on the given information from table of probability distributions of returns on investment individual shares and portfolio below: Table 3: Probability distributions of returns on investment for individual shares and portfolio.
The following questions are based on the given information from table of probability distributions of returns on investment individual shares and portfolio below: Table 3: Probability distributions of returns on investment for individual shares and portfolio.

Essentials of Business Analytics (MindTap Course List)
2nd Edition
ISBN:9781305627734
Author:Jeffrey D. Camm, James J. Cochran, Michael J. Fry, Jeffrey W. Ohlmann, David R. Anderson
Publisher:Jeffrey D. Camm, James J. Cochran, Michael J. Fry, Jeffrey W. Ohlmann, David R. Anderson
Chapter3: Data Visualization
Section: Chapter Questions
Problem 10P: The file Fortune500 contains data for profits and market capitalizations from a recent sample of...

Related questions

Question
Transcribed Image Text:) The following questions are based on the given information from table of probability
distributions of returns on investment individual shares and portfolio below:
Table 3: Probability distributions of returns on investment for individual shares and
portfolio.
State of Probability
of the
States
Return on
Share A
Return on
Share B
(rB)
Return on Portfolio AB
(ran)
Economy
(ra)
0.20
0.20
0.20
0.20
0.20
15%
-5%
5%
35%
25%
-5%
15%
25%
5%
35%
5%
5%
15%
20%
30%
-234
![Given:
Expected return Share A(fa)
Expected return Share B (fB)
Expected return Portfolio A and B (faB)
15%
15%
15%
By using the above information, demonstrate the rate of risk (variance and standard
déviation) for each of:
(i)
Share A
[Saham A]
(ii)
Share B
[Saham B]
(iii) Portfolio A and B
[Portfolio A dan BỊ
I| ||||](/v2/_next/image?url=https%3A%2F%2Fcontent.bartleby.com%2Fqna-images%2Fquestion%2F545cd8f2-002a-4fd9-8b6f-d7c23c272bcf%2Ff6ff76c0-5d64-4d2c-9221-5e5967ad8f96%2Fw1a5qi_processed.png&w=3840&q=75)
Transcribed Image Text:Given:
Expected return Share A(fa)
Expected return Share B (fB)
Expected return Portfolio A and B (faB)
15%
15%
15%
By using the above information, demonstrate the rate of risk (variance and standard
déviation) for each of:
(i)
Share A
[Saham A]
(ii)
Share B
[Saham B]
(iii) Portfolio A and B
[Portfolio A dan BỊ
I| ||||
Expert Solution
This question has been solved!
Explore an expertly crafted, step-by-step solution for a thorough understanding of key concepts.

Step by step
Solved in 3 steps with 4 images

Knowledge Booster


Learn more about
Need a deep-dive on the concept behind this application? Look no further. Learn more about this topic, finance and related others by exploring similar questions and additional content below.Recommended textbooks for you
Essentials of Business Analytics (MindTap Course …
Statistics
ISBN:
9781305627734
Author:
Jeffrey D. Camm, James J. Cochran, Michael J. Fry, Jeffrey W. Ohlmann, David R. Anderson
Publisher:
Cengage Learning
Essentials of Business Analytics (MindTap Course …
Statistics
ISBN:
9781305627734
Author:
Jeffrey D. Camm, James J. Cochran, Michael J. Fry, Jeffrey W. Ohlmann, David R. Anderson
Publisher:
Cengage Learning