The following scatter plot was made from a random sample of 500 adult males. The x-axis is height in inches. The y-axis is weight in pounds. The equation of best fit line and the correlation coefficient (r) is also given. Height vs. Weight for 500 alult males 240 y = 5.815x + -213.594 r- 0.85 220 200 S 180 - 160- 140 67 69 1 73 75 77 63 65 Height (inches) (a) Is it true that the tallest of the 500 men also weighs the most? (b) Use the equation of the line of best fit to predict the weight of a man who is 72 inches tall. (c) Would it be appropriate to use this equation to predict the weight of a man who is 6 foot 6 inches tall? Why or why not? Weight (Ibs)
The following scatter plot was made from a random sample of 500 adult males. The x-axis is height in inches. The y-axis is weight in pounds. The equation of best fit line and the correlation coefficient (r) is also given. Height vs. Weight for 500 alult males 240 y = 5.815x + -213.594 r- 0.85 220 200 S 180 - 160- 140 67 69 1 73 75 77 63 65 Height (inches) (a) Is it true that the tallest of the 500 men also weighs the most? (b) Use the equation of the line of best fit to predict the weight of a man who is 72 inches tall. (c) Would it be appropriate to use this equation to predict the weight of a man who is 6 foot 6 inches tall? Why or why not? Weight (Ibs)

Glencoe Algebra 1, Student Edition, 9780079039897, 0079039898, 2018
18th Edition
ISBN:9780079039897
Author:Carter
Publisher:Carter
Chapter4: Equations Of Linear Functions
Section4.5: Correlation And Causation
Problem 24PFA

Related questions
Question
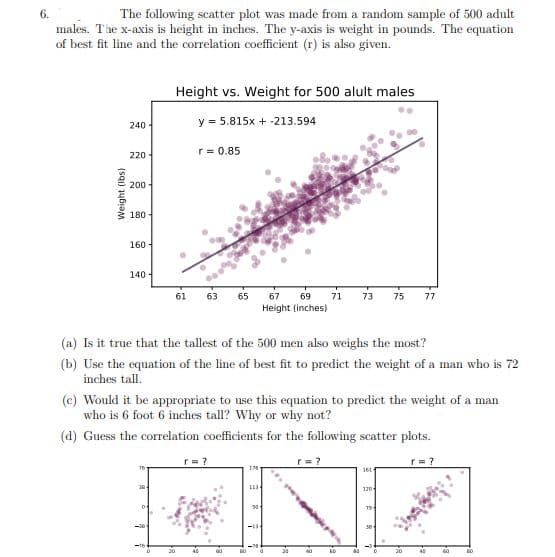
Transcribed Image Text:6.
males. T'he x-axis is height in inches. The y-axis is weight in pounds. The equation
of best fit line and the correlation coefficient (r) is also given.
The following scatter plot was made from a random sample of 500 adult
Height vs. Weight for 500 alult males
240-
y = 5.815x + -213.594
r = 0.85
220
200
180
160 -
140-
61
63
65
67
69
71
73
75
77
Height (inches)
(a) Is it true that the tallest of the 500 men also weighs the most?
(b) Use the equation of the line of best fit to predict the weight of a man who is 72
inches tall.
(c) Would it be appropriate to use this equation to predict the weight of a man
who is 6 foot 6 inches tall? Why or why not?
(d) Guess the correlation coefficients for the following scatter plots.
r=?
r= ?
r= ?
161
120
-T6
20
(sqi) jybiaM
Expert Solution
This question has been solved!
Explore an expertly crafted, step-by-step solution for a thorough understanding of key concepts.

This is a popular solution!

Trending now
This is a popular solution!

Step by step
Solved in 2 steps

Recommended textbooks for you
Glencoe Algebra 1, Student Edition, 9780079039897…
Algebra
ISBN:
9780079039897
Author:
Carter
Publisher:
McGraw Hill
Glencoe Algebra 1, Student Edition, 9780079039897…
Algebra
ISBN:
9780079039897
Author:
Carter
Publisher:
McGraw Hill