The following stem-and-leaf diagram represents the number of cars sold over a period of 16 days in January. Stem Leaf 1 1 7 8 6 9 5 8 9 6 10 0 7 11 2 12 1 13 Key: 510 means 50 cars a) Calculate the mean and standard deviation for the number of cars sold in January. b) The mean and standard deviation of the cars sold in May and July is summarized in the following table. Using an appropriate measure, determine which month (January, May, or July) is most consistent in selling a car. Descriptive Statistics N Mean Std. Deviation No. of Car Sold in May 16 94.81 No. of Car Sold in July 16 91.42 19.637 20.561
The following stem-and-leaf diagram represents the number of cars sold over a period of 16 days in January. Stem Leaf 1 1 7 8 6 9 5 8 9 6 10 0 7 11 2 12 1 13 Key: 510 means 50 cars a) Calculate the mean and standard deviation for the number of cars sold in January. b) The mean and standard deviation of the cars sold in May and July is summarized in the following table. Using an appropriate measure, determine which month (January, May, or July) is most consistent in selling a car. Descriptive Statistics N Mean Std. Deviation No. of Car Sold in May 16 94.81 No. of Car Sold in July 16 91.42 19.637 20.561

Glencoe Algebra 1, Student Edition, 9780079039897, 0079039898, 2018
18th Edition
ISBN:9780079039897
Author:Carter
Publisher:Carter
Chapter10: Statistics
Section10.4: Distributions Of Data
Problem 19PFA

Related questions
Question
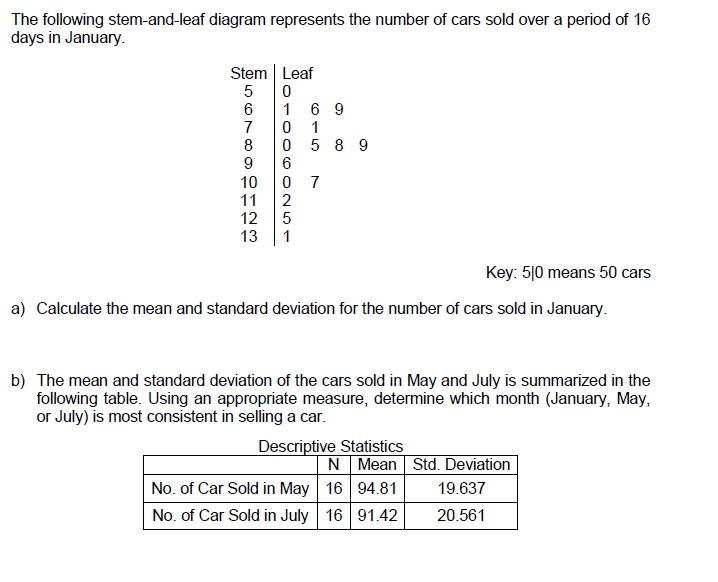
Transcribed Image Text:The following stem-and-leaf diagram represents the number of cars sold over a period of 16
days in January.
Stem Leaf
6 9
1
5 8 9
6
0 7
1
10
11
12
13
1
Key: 5|0 means 50 cars
a) Calculate the mean and standard deviation for the number of cars sold in January.
b) The mean and standard deviation of the cars sold in May and July is summarized in the
following table. Using an appropriate measure, determine which month (January, May,
or July) is most consistent in selling a car.
Descriptive Statistics
N Mean Std. Deviation
No. of Car Sold in May 16 94.81
No. of Car Sold in July 16 91.42
19.637
20.561
56789은일은
Expert Solution
This question has been solved!
Explore an expertly crafted, step-by-step solution for a thorough understanding of key concepts.

This is a popular solution!

Trending now
This is a popular solution!

Step by step
Solved in 4 steps

Recommended textbooks for you
Glencoe Algebra 1, Student Edition, 9780079039897…
Algebra
ISBN:
9780079039897
Author:
Carter
Publisher:
McGraw Hill
Glencoe Algebra 1, Student Edition, 9780079039897…
Algebra
ISBN:
9780079039897
Author:
Carter
Publisher:
McGraw Hill