The following table contains observed frequencies for a sample of 200. Column Variable Row Variable A B P 20 44 50 30 26 30 Test for independence of the row and column variables using a = 0.05 . Compute the value of the x test statistic (to 2 decimals). Use Table 3 of Appendix B to find the p-value. The p-value is between 0.01 and 0.025 What is your conclusion? Conclude the row variable and column variable are not independent
The following table contains observed frequencies for a sample of 200. Column Variable Row Variable A B P 20 44 50 30 26 30 Test for independence of the row and column variables using a = 0.05 . Compute the value of the x test statistic (to 2 decimals). Use Table 3 of Appendix B to find the p-value. The p-value is between 0.01 and 0.025 What is your conclusion? Conclude the row variable and column variable are not independent

Glencoe Algebra 1, Student Edition, 9780079039897, 0079039898, 2018
18th Edition
ISBN:9780079039897
Author:Carter
Publisher:Carter
Chapter10: Statistics
Section10.3: Measures Of Spread
Problem 1GP

Related questions
Question
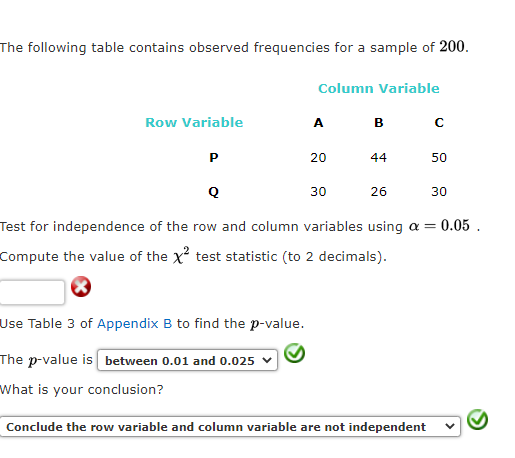
Transcribed Image Text:The following table contains observed frequencies for a sample of 200.
Column Variable
Row Variable
A
B
P
20
44
50
30
26
30
Test for independence of the row and column variables using a = 0.05 .
Compute the value of the x test statistic (to 2 decimals).
Use Table 3 of Appendix B to find the p-value.
The p-value is between 0.01 and 0.025
What is your conclusion?
Conclude the row variable and column variable are not independent
Expert Solution
This question has been solved!
Explore an expertly crafted, step-by-step solution for a thorough understanding of key concepts.

This is a popular solution!

Trending now
This is a popular solution!

Step by step
Solved in 2 steps with 1 images

Recommended textbooks for you
Glencoe Algebra 1, Student Edition, 9780079039897…
Algebra
ISBN:
9780079039897
Author:
Carter
Publisher:
McGraw Hill
Glencoe Algebra 1, Student Edition, 9780079039897…
Algebra
ISBN:
9780079039897
Author:
Carter
Publisher:
McGraw Hill