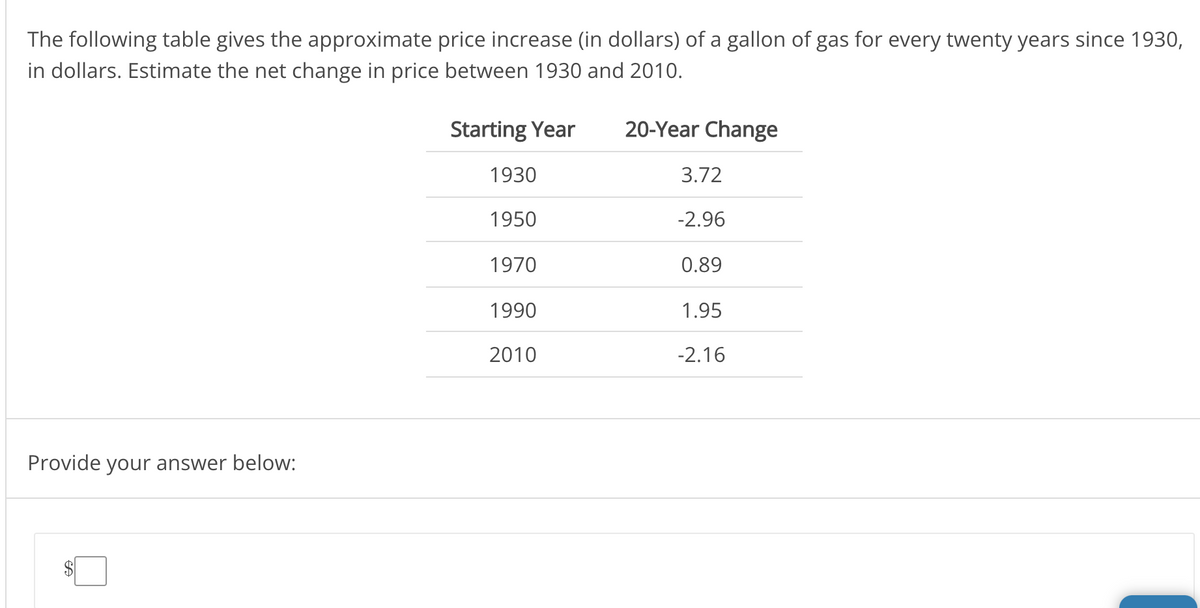
The following table gives the approximate price increase (in dollars) of a gallon of gas for every twenty years since 1930, in dollars. Estimate the net change in price between 1930 and 2010. Starting Year 20-Year Change 1930 3.72 1950 -2.96 1970 0.89 1990 1.95 2010 -2.16
The following table gives the approximate price increase (in dollars) of a gallon of gas for every twenty years since 1930, in dollars. Estimate the net change in price between 1930 and 2010. Starting Year 20-Year Change 1930 3.72 1950 -2.96 1970 0.89 1990 1.95 2010 -2.16

Functions and Change: A Modeling Approach to College Algebra (MindTap Course List)
6th Edition
ISBN:9781337111348
Author:Bruce Crauder, Benny Evans, Alan Noell
Publisher:Bruce Crauder, Benny Evans, Alan Noell
Chapter1: Functions
Section1.2: Functions Given By Tables
Problem 2TU: Use the table of values you made in part 4 of the example to find the limiting value of the average...

Related questions
Question
urgent solve urgent urgent please please
Transcribed Image Text:The following table gives the approximate price increase (in dollars) of a gallon of gas for every twenty years since 1930,
in dollars. Estimate the net change in price between 1930 and 2010.
Starting Year
20-Year Change
1930
3.72
1950
-2.96
1970
0.89
1990
1.95
2010
-2.16
Provide your answer below:
Expert Solution
This question has been solved!
Explore an expertly crafted, step-by-step solution for a thorough understanding of key concepts.

This is a popular solution!

Trending now
This is a popular solution!

Step by step
Solved in 2 steps

Recommended textbooks for you
Functions and Change: A Modeling Approach to Coll…
Algebra
ISBN:
9781337111348
Author:
Bruce Crauder, Benny Evans, Alan Noell
Publisher:
Cengage Learning


College Algebra (MindTap Course List)
Algebra
ISBN:
9781305652231
Author:
R. David Gustafson, Jeff Hughes
Publisher:
Cengage Learning
Functions and Change: A Modeling Approach to Coll…
Algebra
ISBN:
9781337111348
Author:
Bruce Crauder, Benny Evans, Alan Noell
Publisher:
Cengage Learning
College Algebra (MindTap Course List)
Algebra
ISBN:
9781305652231
Author:
R. David Gustafson, Jeff Hughes
Publisher:
Cengage Learning


Glencoe Algebra 1, Student Edition, 9780079039897…
Algebra
ISBN:
9780079039897
Author:
Carter
Publisher:
McGraw Hill
