According to a high-profile realtor, houses in the sleepy town of Sun Beach have shown higher appreciation over the past three years than have houses in the bustling town of North Arden. To test the realtor's claim, an economist has found eleven recently sold homes in Sun Beach and eleven recently sold homes in North Arden that were owned for exactly three years. The following table gives the appreciation (expressed as a percentage increase) for each of the twenty-two houses. Appreciation rates in percent Sun Beach 8.7, 10.5, 12.3, 11.0,10.9, 10.2, 10.7, 10.3, 9.2, 10.2, 12.5 North Arden 13.1, 10.2, 10.8, 8.4, 10.4, 6.9, 14.9, 7.5, 6.8, 8.8, 9.2 Send data to calculator ♥ Assume that the two populations of appreciation rates are normally distributed and that the population variances are equal. Can we conclude, at the 0.05 level of significance, that houses in Sun Beach have higher appreciation over the past three years than houses in North Arden? Perform a one-tailed test. Then fill in the table below. Carry your intermediate computations to at least three decimal places and round your answers as specified in the table. (If necessary, consult a list of formulas.) The null hypothesis: # :0 The alternative hypothesis: D=0 OSO The type of test statistic: (Choose one) v O
According to a high-profile realtor, houses in the sleepy town of Sun Beach have shown higher appreciation over the past three years than have houses in the bustling town of North Arden. To test the realtor's claim, an economist has found eleven recently sold homes in Sun Beach and eleven recently sold homes in North Arden that were owned for exactly three years. The following table gives the appreciation (expressed as a percentage increase) for each of the twenty-two houses. Appreciation rates in percent Sun Beach 8.7, 10.5, 12.3, 11.0,10.9, 10.2, 10.7, 10.3, 9.2, 10.2, 12.5 North Arden 13.1, 10.2, 10.8, 8.4, 10.4, 6.9, 14.9, 7.5, 6.8, 8.8, 9.2 Send data to calculator ♥ Assume that the two populations of appreciation rates are normally distributed and that the population variances are equal. Can we conclude, at the 0.05 level of significance, that houses in Sun Beach have higher appreciation over the past three years than houses in North Arden? Perform a one-tailed test. Then fill in the table below. Carry your intermediate computations to at least three decimal places and round your answers as specified in the table. (If necessary, consult a list of formulas.) The null hypothesis: # :0 The alternative hypothesis: D=0 OSO The type of test statistic: (Choose one) v O

Glencoe Algebra 1, Student Edition, 9780079039897, 0079039898, 2018
18th Edition
ISBN:9780079039897
Author:Carter
Publisher:Carter
Chapter4: Equations Of Linear Functions
Section4.5: Correlation And Causation
Problem 2CYU

Related questions
Topic Video
Question
100%
I know the type of test is a T-test
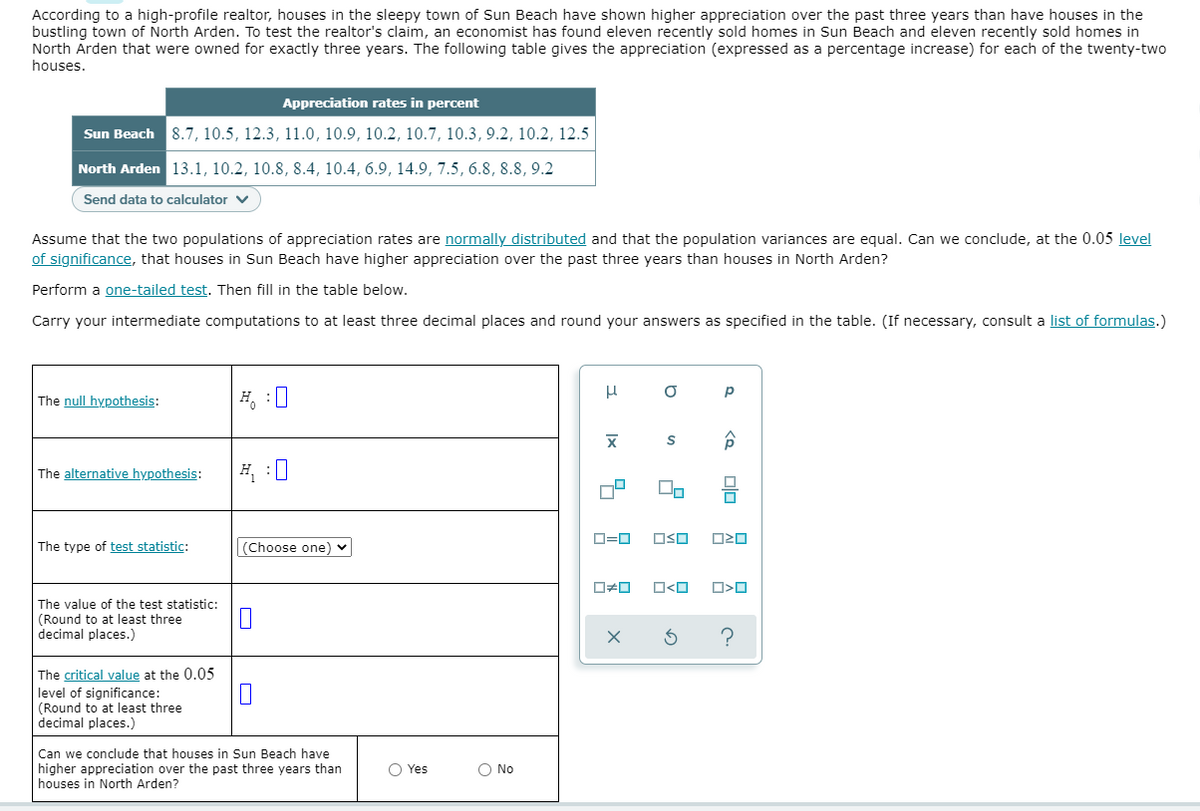
Transcribed Image Text:According to a high-profile realtor, houses in the sleepy town of Sun Beach have shown higher appreciation over the past three years than have houses in the
bustling town of North Arden. To test the realtor's claim, an economist has found eleven recently sold homes in Sun Beach and eleven recently sold homes in
North Arden that were owned for exactly three years. The following table gives the appreciation (expressed as a percentage increase) for each of the twenty-two
houses.
Appreciation rates in percent
Sun Beach 8.7, 10.5, 12.3, 11.0, 10.9, 10.2, 10.7, 10.3, 9.2, 10.2, 12.5
North Arden 13.1, 10.2, 10.8, 8.4, 10.4, 6.9, 14.9, 7.5, 6.8, 8.8, 9.2
Send data to calculator v
Assume that the two populations of appreciation rates are normally distributed and that the population variances are equal. Can we conclude, at the 0.05 level
of significance, that houses in Sun Beach have higher appreciation over the past three years than houses in North Arden?
Perform a one-tailed test. Then fill in the table below.
Carry your intermediate computations to at least three decimal places and round your answers as specified in the table. (If necessary, consult a list of formulas.)
H, :0
p
The null hypothesis:
The alternative hypothesis:
O=0
OSO
The type of test statistic:
(Choose one)
The value of the test statistic:
(Round to at least three
decimal places.)
The critical value at the 0.05
level of significance:
(Round to at least three
decimal places.)
Can we conclude that houses in Sun Beach have
higher appreciation over the past three years than
houses in North Arden?
O Yes
O No
Ix
Expert Solution
This question has been solved!
Explore an expertly crafted, step-by-step solution for a thorough understanding of key concepts.

This is a popular solution!

Trending now
This is a popular solution!

Step by step
Solved in 3 steps

Knowledge Booster


Learn more about
Need a deep-dive on the concept behind this application? Look no further. Learn more about this topic, statistics and related others by exploring similar questions and additional content below.Recommended textbooks for you
Glencoe Algebra 1, Student Edition, 9780079039897…
Algebra
ISBN:
9780079039897
Author:
Carter
Publisher:
McGraw Hill

Glencoe Algebra 1, Student Edition, 9780079039897…
Algebra
ISBN:
9780079039897
Author:
Carter
Publisher:
McGraw Hill