According to a high-profile realtor, houses in the sleepy town of Sun Beach have shown higher appreciation over the past three years than have houses in the bustling town of North Arden. To test the realtor's claim, an economist has found fourteen recently sold homes in Sun Beach and fourteen recently sold homes in North Arden that were owned for exactly three years. The following table gives the appreciation (expressed as a percentage increase) for each of the twenty- eight houses. Appreciation rates in percent Sun Beach 12.9, 8.4, 7.0, 11.9, 6.2,9.9, 13.9, 11.9, 11.3, 10.9, 13.4, 7.5, 11.0, 11.1 North Arden 13.4,9.8, 4.9, 8.6, 11.8,9.3,8.1, 7.8, 11.7, 12.2, 9.6, 7.1, 7.3, 8.6 Send data to calculator Send data to Excel Assume that the two populations of appreciation rates are normally distributed and that the population variances are equal. Can we conclude, at the 0.05 level of significance, that the mean appreciation rate of houses in Sun Beach, u, is higher than u, the mean appreciation rate of houses in North Arden? Perform a one-tailed test. Then complete the parts below. Carry your intermediate computations to three or more decimal places and round your answers as specified in the table. (If necessary, consult a list of formulas.) (a) State the null hypothesis H, and the alternative hypothesis H. Ho :0 H :0 (b) Determine the type of test statistic to use. D=0 OSO (Choose one) (c) Find the value of the test statistic. (Round to three or more decimal places.) ロロ O
According to a high-profile realtor, houses in the sleepy town of Sun Beach have shown higher appreciation over the past three years than have houses in the bustling town of North Arden. To test the realtor's claim, an economist has found fourteen recently sold homes in Sun Beach and fourteen recently sold homes in North Arden that were owned for exactly three years. The following table gives the appreciation (expressed as a percentage increase) for each of the twenty- eight houses. Appreciation rates in percent Sun Beach 12.9, 8.4, 7.0, 11.9, 6.2,9.9, 13.9, 11.9, 11.3, 10.9, 13.4, 7.5, 11.0, 11.1 North Arden 13.4,9.8, 4.9, 8.6, 11.8,9.3,8.1, 7.8, 11.7, 12.2, 9.6, 7.1, 7.3, 8.6 Send data to calculator Send data to Excel Assume that the two populations of appreciation rates are normally distributed and that the population variances are equal. Can we conclude, at the 0.05 level of significance, that the mean appreciation rate of houses in Sun Beach, u, is higher than u, the mean appreciation rate of houses in North Arden? Perform a one-tailed test. Then complete the parts below. Carry your intermediate computations to three or more decimal places and round your answers as specified in the table. (If necessary, consult a list of formulas.) (a) State the null hypothesis H, and the alternative hypothesis H. Ho :0 H :0 (b) Determine the type of test statistic to use. D=0 OSO (Choose one) (c) Find the value of the test statistic. (Round to three or more decimal places.) ロロ O

Chapter12: Sequences, Series And Binomial Theorem
Section12.3: Geometric Sequences And Series
Problem 12.58TI: What is the total effect on the economy of a government tax rebate of $500 to each household in...

Related questions
Question
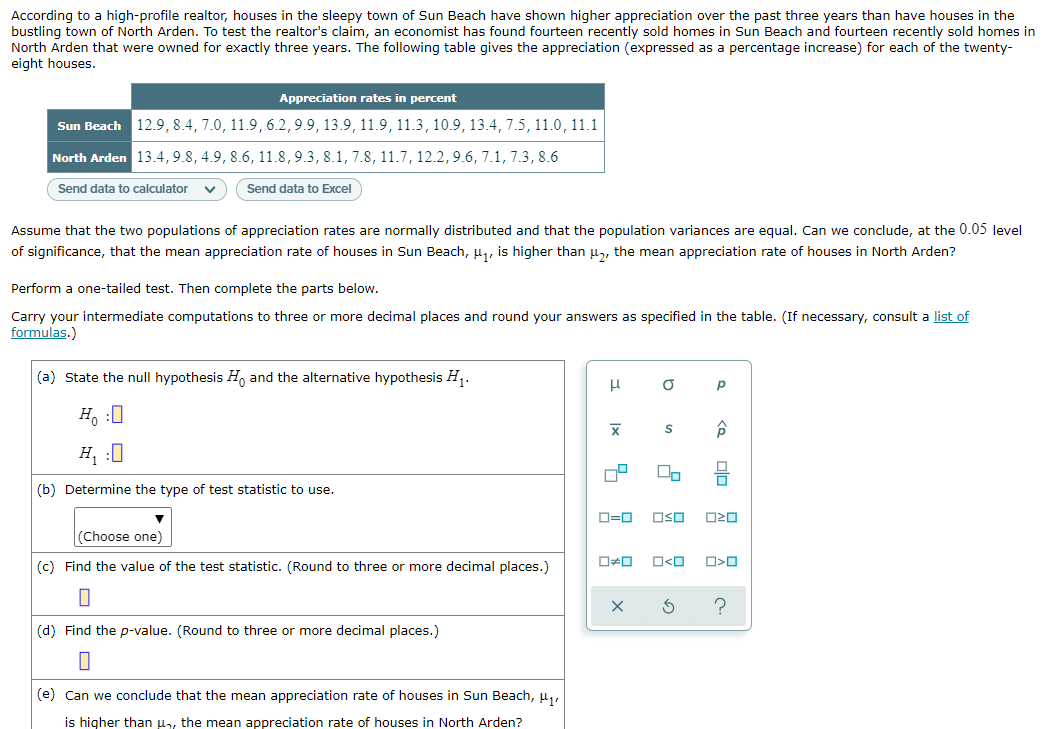
Transcribed Image Text:According to a high-profile realtor, houses in the sleepy town of Sun Beach have shown higher appreciation over the past three years than have houses in the
bustling town of North Arden. To test the realtor's claim, an economist has found fourteen recently sold homes in Sun Beach and fourteen recently sold homes in
North Arden that were owned for exactly three years. The following table gives the appreciation (expressed as a percentage increase) for each of the twenty-
eight houses.
Appreciation rates in percent
Sun Beach 12.9, 8.4, 7.0, 11.9, 6.2,9.9, 13.9, 11.9, 11.3, 10.9, 13.4, 7.5, 11.0, 11.1
North Arden 13.4,9.8, 4.9, 8.6, 11.8,9.3,8.1, 7.8, 11.7, 12.2, 9.6, 7.1, 7.3, 8.6
Send data to calculator
Send data to Excel
Assume that the two populations of appreciation rates are normally distributed and that the population variances are equal. Can we conclude, at the 0.05 level
of significance, that the mean appreciation rate of houses in Sun Beach, u, is higher than u, the mean appreciation rate of houses in North Arden?
Perform a one-tailed test. Then complete the parts below.
Carry your intermediate computations to three or more decimal places and round your answers as specified in the table. (If necessary, consult a list of
formulas.)
(a) State the null hypothesis H, and the alternative hypothesis H.
Ho :0
H :0
(b) Determine the type of test statistic to use.
D=0
OSO
(Choose one)
(c) Find the value of the test statistic. (Round to three or more decimal places.)
ロロ
O<O
(d) Find the p-value. (Round to three or more decimal places.)
(e) Can we conclude that the mean appreciation rate of houses in Sun Beach, u,
is higher than u,, the mean appreciation rate of houses in North Arden?
Ix
Expert Solution
This question has been solved!
Explore an expertly crafted, step-by-step solution for a thorough understanding of key concepts.

This is a popular solution!

Trending now
This is a popular solution!

Step by step
Solved in 6 steps with 2 images

Recommended textbooks for you