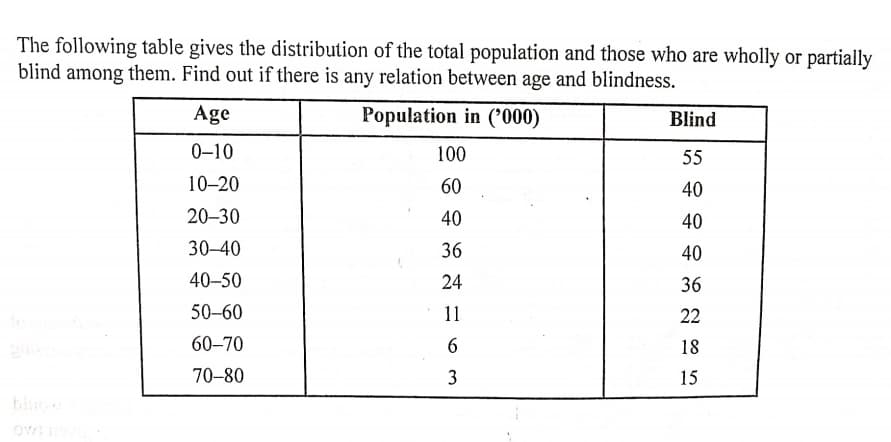
The following table gives the distribution of the total population and those who are wholly or partially blind among them. Find out if there is any relation between age and blindness. Age Population in ('000) Blind 0-10 100 55 10-20 60 40 20-30 40 40 30-40 36 40 40-50 24 36 50-60 11 22 60-70 18 70-80 3 15


Q: Draw a cumulative frequency curve for the following data : Marks No. of students Marks No. of studen...
A:
Q: a. All values of the Measures of Central Tendency b. All elements of the Measures of Dispersion ...
A: Disclaimer : “Since you have posted a question with multiple sub-parts, we will solve first three su...
Q: Solve the problem below, showing your work for each step by filling-in the blanks. Round all z-score...
A: Let X be the random variable from normal distribution with mean (μ) = 20.7 and standard deviation (σ...
Q: There are three containers, A, B and C. Each container contains 25 balls, which are either red or bl...
A: Probability : The term "probability" merely refers to the chance of one thing occurring. we will con...
Q: answer c & d only
A: Given X~Nμ1,σ12 with sample size nY~Nμ2,σ22 with sample size m
Q: If a system is such that its input X(t) ind its put Y(1) are related by a convolution integral, i.e....
A:
Q: If X is a normal variate with mean 2 and variance 9, describe the distribution of Y=1/2(x-1).Also de...
A:
Q: A card is drawn from the pack of 52 cards. This experiment is repeated 20 times. The probability dis...
A: Given data is X 1 2 3 4 P(X) 12/20 2/20 2/20 4/20
Q: For An observer stands at an overpass of a highway and counts the vehicles that pass by. He stops co...
A:
Q: A coin is tossed twice. Find the probability of getting at least one head. 1/4 3/4 1/2 3/2
A: Assume E be the event for getting at least one head. The sample space of tossing a coin twice is giv...
Q: Suppose a die is tossed, let A be the event of “an even number turning up” and B be the event of “an...
A:
Q: Generate a 95% confidence interval for the difference in mean ages between groups. Generate a 95%...
A: Solution:
Q: Question 4-6. Results of a retrospective case control study of a chronic disease and exposure to a p...
A: Given data Z test Test statistics z = -6.3 P calue = ?
Q: Derive the moment generating function of X ~ Bi(n, p) and using the MGF compute E[X] and Var[X].
A:
Q: A study was conducted to assess the impact of nutrient enrichment on zooplankton densities in A & B ...
A:
Q: 5) A coin is tossed four times. Let A = event at least two Tails is tossed, B = the Number of tails ...
A: GivenA coin is tossed four timesLet A = event atleast two tails is tossedLet B = the number of tails...
Q: cite three instances that will prove that experimental research is more accurate, and reliable.
A: Prooving That experimental research is more accurate, and reliable
Q: Suppose that 2 balls are randomly selected (without replacement) from an urn containing 3 red, 4 blu...
A: Given Information: Total number of balls in the urn is 12. Number of red balls is 3 Number of Blue b...
Q: Almost all medical schools in the United States require students to take the Medical College Admissi...
A: Solution: Given that: n= 25 Sample sizeμ= 510 Population mean σ= 10.4 Population standard deviation....
Q: Pearson r of .70 is how much stronger than a Pearson r of .00 in terms of shared variance between th...
A: We have given that r = 0.70 and also r = 0.00
Q: 0435 2512 0290 2452 6392 5306 7507 7268 8818 8028 3481 9296 2670 6810 1773 3557 4172 7737 9874 5463 ...
A:
Q: a 24-hour call center, complaints arrive at a mean rate of 1 complaint every 3 hours. (a) Find the ...
A:
Q: In this assignment, I would like you to compute the chi-square goodness of fit test for an observed ...
A: Given Information:Consider the data that shows the observed counts of F2 offspring from an F1 cross....
Q: Page of Month Actual Sales Naive Forecast - Absolute Value of (# of Product X) Sales Errors (# of Pr...
A:
Q: The Green party of Canada is planning on conducting a survey to estimate the proportion of Canadians...
A:
Q: Ha: p< 0.65 A sample of 300 items was selected. Compute the p-value and state your conclusion for ea...
A: GivenH0:p≥0.65Ha:p<0.65sample size(n)=300α=0.05
Q: Find the indicated IQ score. The graph to the right depicts IQ scores of adults, and those scores ar...
A: Solution-: Given: μ=100,σ=15 We find x- value=?
Q: Sex education in public schools * Respondents sex Crosstabulation Respondents sex MALE FEMALE Total ...
A:
Q: The supervisor of MCL Group of Companies claims that the mean weight of their laundry product is 350...
A:
Q: 2. A researcher transferred two hybrid Red color fishes, from a pure line Red color fish as dominant...
A: Chi-square test : Chi-square test helps to determine the significant difference between the observed...
Q: 4) You are given the following data set: 11, 10, 9, 13, 11, 8, 3, Find the mode, median and mean. Wh...
A:
Q: P (-∞ < z < 0) = A.zero B.0.5 C.1 D.2
A: The standard normal variable is z, which follows the normal distribution with the mean of 0 and stan...
Q: Identify and explain the key elements in probability sampling.
A: There are 2 types of sampling: Prob. sampling Non-prob. sampling
Q: State the Five Number Summary for the following dataset. 44 45 46 47 49 51 54 55 58...
A:
Q: The amount of coffee that people drink per day is normally distributed with a mean of 14 ounces and ...
A: As per bartelby guideline expert have to answer first three subparts only dear student please upload...
Q: X If two RVSX and Y are independent, find the pdf ofZ= in terms of the density Y functions of X and ...
A:
Q: NBC News/Marist sampled 603 likely voters on 10-31-14. They found that 44% said they would vote for ...
A:
Q: Let X1,..., Xn an iid random sample from Gamma(a, X). Show that [I-1 X; and E X; are jointly suffici...
A: Given: random variables Xi (i=1,2,....n) are iid from gamma(α,λ) then to show that ∏Xi and ∑Xi is ...
Q: Draw the two ogives for thhe following distribution showing the number of marks of 59 students : Mar...
A:
Q: 3) Calculate the mean, the median and the mode of each of the following data sets a. 2, 3, 4, 5, 7, ...
A: Mean = ΣXi/n Here sample size is n= 7 Mean = (2+3+4+5+7+7+7)/7 =35/7 = 5 Here 7 occurs highest times...
Q: Two random samples were drawn from two normal populations and their values are: A : 66 75 67 76 82 8...
A:
Q: 4 Example 4. The average cost for a commodity is given by AC = x + 4 +. Find the total and marginal ...
A:
Q: 4 Example 4. The average cost for a commodity is given by AC = x + 4 +-. Find the total and marginal...
A:
Q: The mean daily production of a herd of cows is assumed to be normally distributed with a mean of 36 ...
A: Given,mean(μ)=36standard deviation(σ)=6.3
Q: (X1, X2, X3)' be a random sample from N(u, 1). Use the Fisher-Neyman Factorization Theorem to find a...
A:
Q: Draw the two ogives for the following distribution showing the number of marks of 59 students : Mark...
A: Given: MARKS FREQUENCY 0-10 4 10-20 8 20-30 11 30-40 15 40-50 12 50-60 6 60-70 3...
Q: School administrators asked a group of students and teachers which of two school logo ideas, logo A ...
A:
Q: Suppose (X,Y) is a joint continuous random variable with joint density function, f(x, y) = {cry, for...
A: Given,f(x,y)=cxy ; 1<X<2, 1<y<20 ; otherwise
Q: 2. Suppose there is a race between 9 friends. How many ways can the race be completed if John is fir...
A: Here use concept of total arrangement
Q: Which of the following statements defines the 75th percentile value for a data sample?
A: here as per policy i have calculated first main question here use definition of percentile

Step by step
Solved in 3 steps with 3 images

- Calculate coefficient of correlation for the question; marks in economic and marks in statistics as given in the image.In a psychological testing experiment, 25 subjects are selected randomly and their reaction time, in seconds, to a particular stimulus is measured. Past experience suggests that the variance in reaction times to these types of stimuli is 4 sec2 and that the distribution of reaction times is approximately normal. The average time for the subjects is 6.2 seconds. Give an upper 95% bound for the mean reaction time.Suppose that,to test the profitability of name changes in the more recent market (the past 5 years), we analyze the stock prices of a large sample of corporations shortly after they changed names, and we finds that the mean relative increase in stock price was about 0.79% with a standard deviation of 0.12%. Suppose that this mean and standard deviation apply to the population of all companies that changed named during the past five years. Complete the following statements about the distribution of relative increases in stock prices for all companies that changed names. A/ according to chebyshev's theorem, at least ? Of the relative increases in stock price lie between 0.55% and 1.03%? 36%, 56%, 75%, 84% or 89% According to chebyshev's theorem, at least 56% of the relative increases in stock price lie between ? And ? %
- Suppose that the return for a particular investment is normally distributed with a population mean of 10.1% and a population standard deviation of 5.4%. A person must score in the upper 5% of the population on an IQ test to qualify for a particular occupation If IQ scores are normally distributed with a mean of 100 and a standard deviation of 15, what score must a person have to qualify for this occupation?Suppose the scores of students on an exam are normally distributed with a mean of 520 and a standard deviation of 91. Then approximately 68% of the exam scores lie between the intergers____ and ____ such that the mean is halfway between these two intergers.Use the central limit theorem to find the mean and standard error of the mean of the indicated sampling distribution. Then sketch a graph of the sampling distribution. The per capita consumption of red meat by people in a country in a recent year was normally distributed, with a mean of 100 pounds and a standard deviation of 38.6 pounds. Random samples of size 20 are drawn from this population and the mean of each sample is determined. ux= o-x= graph=
- Use the central limit theorem to find the mean and standard error of the mean of the indicated sampling distribution. Then sketch a graph of the sampling distribution. The per capita consumption of red meat by people in a country in a recent year was normally distributed, with a mean of 102 pounds and a standard deviation of 37.1 pounds. Random samples of size 17 are drawn from this population and the mean of each sample is determined.Suppose that the daily viewing time is normally distributed with a mean of is 8.35 hours and a standard deviation of 2.5 hours. How many hours of television viewing must a household have in order to be in the top 3% of all television viewing households?Suppose that the times taken for germination for cauliflower seeds are normally distributed with a mean of 7.2 days. Suppose also that exactly 85% of the cauliflower seeds germinate in 5.9 days or more. Find the standard deviation of times taken for germination for cauliflower seeds.Carry your intermediate computations to at least four decimal places. Round your answer to at least two decimal places.
- Suppose that the times taken for germination for cauliflower seeds are normally distributed with a mean of 7.1 days. Suppose also that exactly 70% of the cauliflower seeds germinate in 6.1 days or more. Find the standard deviation of times taken for germination for cauliflower seeds. Carry your intermediate computations to at least four decimal places. Round your answer to at least two decimal places.Suppose that the blood pressure of the human inhabitants of a certain Pacific island is distributed with mean, μ = 90 mmHg and standard deviation , σ = 8 mmHg. According to Chebyshev's Theorem, at least what percentage of the islander's have blood pressure in the range from 74 mmHg to 106 mmHg ?Use the central limit theorem to find the mean and standard error of the mean of the indicated sampling distribution. Then sketch a graph of the sampling distribution. The per capita consumption of red meat by people in a country in a recent year was normally distributed, with a mean of 109pounds and a standard deviation of 37.9 pounds. Random samples of size 19 are drawn from this population and the mean of each sample is determined. μx= σx=