. For which data set is the sample correlation coefficient r closest to 0? B. Which data set has an apparent negative, but not perfect, linear relationship between its two variables?
. For which data set is the sample correlation coefficient r closest to 0? B. Which data set has an apparent negative, but not perfect, linear relationship between its two variables?

College Algebra (MindTap Course List)
12th Edition
ISBN:9781305652231
Author:R. David Gustafson, Jeff Hughes
Publisher:R. David Gustafson, Jeff Hughes
Chapter8: Sequences, Series, And Probability
Section8.CR: Chapter Review
Problem 37E: Find the positive geometric mean between 4 and 64.

Related questions
Question
A. For which data set is the sample
B. Which data set has an apparent negative, but not perfect, linear relationship between its two variables?
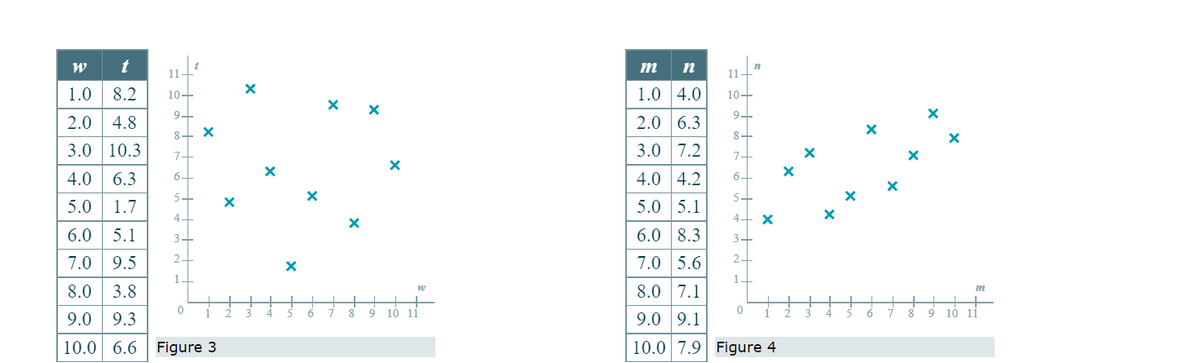
Transcribed Image Text:W
t
1.0 8.2
2.0
4.8
3.0 10.3
4.0 6.3
5.
5.0
1.7
4+
6.0 5.1 3.
7.0 9.5
2.
1
8.0
3.8
9.0 9.3
10.0 6.6 Figure 3
11
10+
9-
8 X
7
6 +
0
X
2
X
3
X
4
X
5
X
6
7
X
8
X
X
W
9 10 11
m n
1.0 4.0
2.0 6.3
3.0 7.2
n
11+
10+
9+
8+
7-
4.0 4.2
5.0 5.1
6.0 8.3
7.0 5.6
8.0 7.1
9.0 9.1
10.0 7.9 Figure 4
4+ X
3-
2
0
X
X
3 4
X
3
X
6
X
7
X
8
X
9
X
m
10 11
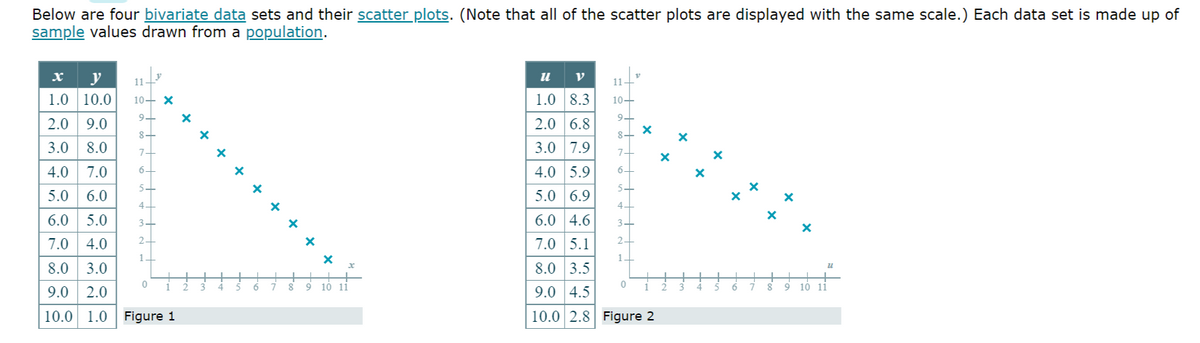
Transcribed Image Text:Below are four bivariate data sets and their scatter plots. (Note that all of the scatter plots are displayed with the same scale.) Each data set is made up of
sample values drawn from a population.
x y
11
1.0 10.0 10- X
9+
8+
7+
6.
2.0 9.0
3.0 8.0
4.0 7.0
5.0
6.0
6.0 5.0
7.0 4.0
8.0 3.0
9.0 2.0
10.0 1.0 Figure 1
5+
4+
3-
2+
1.
0
+
X
X
6
X
X
X
8
X
x
9 10 11
11-
u V
1.0 8.3 10+
2.0 6.8
3.0 7.9
4.0 5.9
9-
8+
7+
6.
5.0 6.9
6.0 4.6
7.0 5.1
8.0 3.5
9.0 4.5
10.0 2.8 Figure 2
4-
3+
2+
0
X
X
X
6
*
8 9
X
10 11
U1
Expert Solution
This question has been solved!
Explore an expertly crafted, step-by-step solution for a thorough understanding of key concepts.

This is a popular solution!

Trending now
This is a popular solution!

Step by step
Solved in 3 steps with 3 images

Recommended textbooks for you
College Algebra (MindTap Course List)
Algebra
ISBN:
9781305652231
Author:
R. David Gustafson, Jeff Hughes
Publisher:
Cengage Learning

Holt Mcdougal Larson Pre-algebra: Student Edition…
Algebra
ISBN:
9780547587776
Author:
HOLT MCDOUGAL
Publisher:
HOLT MCDOUGAL

Algebra & Trigonometry with Analytic Geometry
Algebra
ISBN:
9781133382119
Author:
Swokowski
Publisher:
Cengage
College Algebra (MindTap Course List)
Algebra
ISBN:
9781305652231
Author:
R. David Gustafson, Jeff Hughes
Publisher:
Cengage Learning
Holt Mcdougal Larson Pre-algebra: Student Edition…
Algebra
ISBN:
9780547587776
Author:
HOLT MCDOUGAL
Publisher:
HOLT MCDOUGAL
Algebra & Trigonometry with Analytic Geometry
Algebra
ISBN:
9781133382119
Author:
Swokowski
Publisher:
Cengage

Glencoe Algebra 1, Student Edition, 9780079039897…
Algebra
ISBN:
9780079039897
Author:
Carter
Publisher:
McGraw Hill