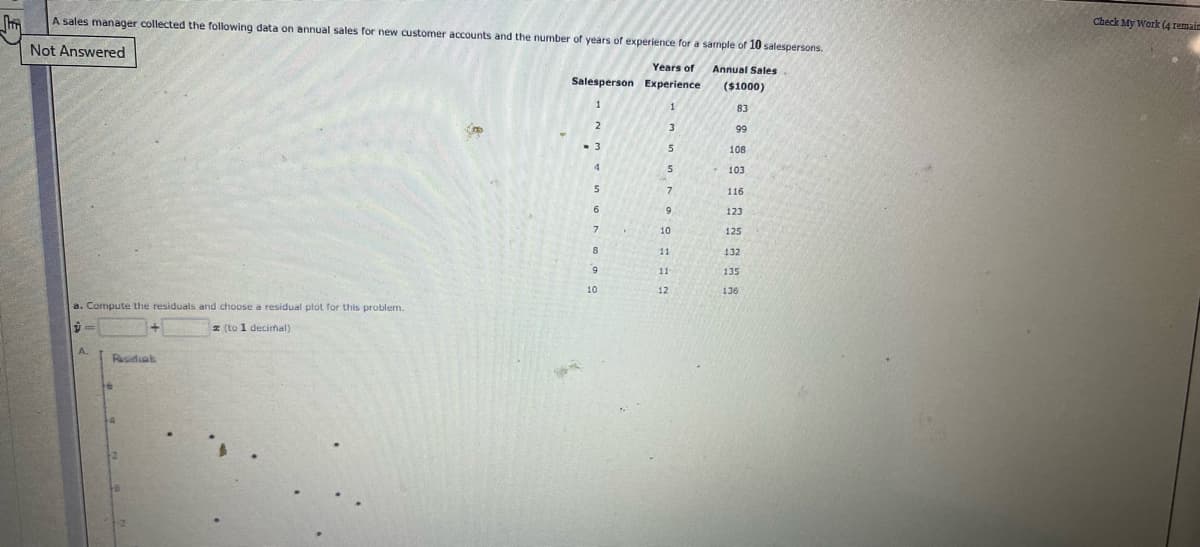
A sales manager collected the following data on annual sales for new customer accounts and the number of years of experience for a sample of 10 salespersons. Check My Work (4 remaie Not Answered Years of Annual Sales Salesperson Experience ($1000) 83 3. 99 108 4. 103 116 6. 123 10 125 11 132 11 135 10 12 136 a. Compute the residuals and choose a residual plot for this problem, z (to 1 decirnal) A. Radiab


Q: Figure Q1 shows a frequency polygon of time (in seconds) taken to download a particular file in a…
A:
Q: A professor grades students on four tests, a term paper, and a final examination. Each test counts…
A:
Q: The mean height of trees in the forest of Zambales is 42 ft and the standard deviation is 3 ft.…
A:
Q: Conduct the hypothesis test and provide the test statistic and the critical value, and state the…
A: For the given data Perform Chi square goodness of fit
Q: Which of the following decreases the chances a person should purchase life insurance? O No…
A: In the given problem we have to answer, which of the following decreases the chance a person should…
Q: The accompanying table gives amounts of arsenic in samples of brown rice from three different…
A: The table shows the amounts of arsenic in samples of brown rice from three different states.
Q: The average height of adult males in the United States is 68.5 inches. Assume that a = 3.1 inches…
A: Given,sample size(n)=15mean(μ)=68.5standard deviation(σ)=3.1
Q: (d) E(Y) = (e) For 0 < x < 1 marginal probability distribution of X is 16 -for 0 < x < 1;÷for 1 < x…
A:
Q: 4. Give the notation for each: number of items in a data set: mean (sample): mean (population):…
A:
Q: The sample of students were asked to judge the module handouts provided by Prof. Juan in the course…
A: Given that, Proportions of students who think that the module handouts are below expectation…
Q: The waist girth of 2,500 employees in a large company follows the normal distribution with mean of…
A:
Q: a adoo m paloud ypea o oo (sunoy u) aun adeuae an Project-1 20 26 Proఆలి 28 Project-3 20 26 19 23 24…
A: Given information: As per guidelines we will solve the first question only, please repost other…
Q: Suppose that IQ’s of 1,200 applicants to a university are approximately normally distributed with a…
A: GivenMean(μ)=120standard deviation(σ)=10
Q: A single card is selected from an ordinary deck of cards. The sample space is shown in the figure.…
A: Given data A single card is selected from an ordinary deck of cards.
Q: which statistical analysis correctly analyzes the repeated measures (also known as within subjects)…
A: In the given problem we have to answer the question, which statistical analysis correctly analyses…
Q: cohabitation? Is the relationship between marital status and attitude toward nonmarital…
A: From the above data The significance level of an event (such as a statistical test) is the…
Q: (a) Find the mean, variance, and standard deviation of the probability distribution. The mean is…
A: We have given that the probability distribution table. The random variable X i.e, defects. Mean =…
Q: 7. When designing an hypothesis test, one of the first decisions that needs to be made is which…
A: Type 1 error - probability of rejecting a null hypothesis when it is true Type 2 error - probability…
Q: y 8 -37 28 -38 68 -24 19 77 68 -69 50 -53 28 190 26 165 17 124 Find the correlation coefficient and…
A: We have given that, The data set are : X :- 8, 28, 68, 19, 68, 50, 28, 26, 17 Y:- -37, -38, -24,…
Q: The scores of individual students on the American College Testing (ACT) Program composite college…
A: We have given that, Mean (μ) = 21.0 and standard deviation (σ) = 7.0 and sample size (n) = 40 Then,…
Q: What is discriminatory ability or power in statistics and how can you show it on course assessments?
A: Please find the explanation below. Thank you
Q: Let’s assume that we know the probabilities that any child will suffer from one of the following…
A:
Q: A manufacturer claims that the mean amount of juice in its 16-ounce bottles is 16.1 ounces. A…
A: Tyoe II ERROR is fail to reject false null hypothesis
Q: 10. The following data represents the salary of the faculties of four universities in Baguio. Five…
A: Anova is used to understand whether there exist mean significance between the more than three…
Q: Describe the null and alternative hypotheses used in hypothesis testing
A: Hypothesis testing is one of the statistical inferential procedures.
Q: Tesearcher in the team, has randomly selected a sample of 25 male runners from a high school and the…
A:
Q: Consider a regression study involving a dependent variable y, a quantitative independent variable…
A:
Q: et X1, X2, ..., Xn be a random sample from a normal distribution with mean u and Fariance o?. ind an…
A: Solution
Q: Study the group of tests administered to a class where Gab belongs, then answer the question. In…
A: here given table of mean and standard deviation of each of subject and Gab's score
Q: Find a 0.90 confidence interval for the mean claim payment. (Round your answers to two decimal…
A: It is given that Sample size n = 360 Sample mean M = 1600 Population SD = 232 The critical values of…
Q: The leading brand of powdered milk in the Philippines has a market share of 45%. A sample of 14…
A: Given that n=14 , p=45%=0.45 , q=1-p=1-0.45=0.55 X~Binomial(n=14,p=0.45) X= Number of leading brand…
Q: A state lottery randomly chooses 5 balls numbered from 1 through 42 without replacement. You choose…
A: Given that 5 tickets are purchased from lottery tickets Lottery tickets number from 1 to 42
Q: Dandelions are studied for their effects on crop production and lawn growth. In one region, the mean…
A: Given that X~Poisson(λ=5) Probability mass function of X is P(X=x)=λxe-λ/x! , x=0,1,2,___
Q: Use a two period binomial tree to price a 12 month European style put option on YMMV struck at $16.…
A:
Q: With 90% confidence the proportion of all people who accept the theory that a person's spirit is no…
A:
Q: Given that x has a Poisson distribution with u = 2, what is the probability that x = 4? ... P(4)…
A:
Q: High Low Aspirations…
A:
Q: The results of the total test scores of 60 test participants as new employees of a hardware company…
A: Given information: 120, 120, 125, 130, 140, 145, 145, 150, 160, 160, 165, 170, 172, 175, 175, 180,…
Q: The U.S. Census Bureau reported in 2002 that, for people 18-24 years old, the mean annual income for…
A: Given that Population mean μ =21539
Q: The waist girth of 2,500 employees in a large company follows the normal distribution with mean of…
A:
Q: The time it takes for the workers to carry out the same assembly is normally distributed with a mean…
A: GivenMean(μ)=30.5standard deviation(σ)=5
Q: Internet tax: In 2013, a consulting company asked 1031 U.S. adults whether they believed that people…
A: It is given that Sample size n = 1031 Number of adults supported an internet sales taxes, X = 443…
Q: In a simple random sample of size 60, there were 39 individuals in the category of interest. Part:…
A: From the provided information, Sample size (n) = 60 From which 39 individuals in the category of…
Q: You conduct a survey and receive the following scores from your participants: 7, 4, 1, 2, 5, 4, 5,…
A: As per company guidelines I solved exactly three subparts of the question . thank you
Q: On a planet far far away from Earth, IQ of the ruling species is normally distributed with a mean of…
A: Since you have posted a question with multiple sub-parts, we will solve first three subparts for…
Q: 1. Use the approach of the Great Theorem of Chapter 10 to determine if 1,679,617 is prime just as…
A: Hello thankyou for the question. According to our honor code can answer only three sub parts at a…
Q: 20 y (1+ Oy²)² > 0. Using an appropriate pivotal quantity, verify that f(y|0) for 2 - a (2 a) Y2 a…
A:
Q: When conducting a right-sided hypothesis test concerning a population proportion, which of the…
A: Consider that p is the true proportion.
Q: In the dataset below 1.15 0.33 0.40 0.33 1.35 0.38 0.25 0.40 0.35 (a) Skewness in the stemplot of…
A:
Q: A New York Times article noted that the mean life span for 6 male symphony conductors was 80.4 years…
A: Given that Hypothesized Population Mean (\mu)(μ) = 67.167.1 Sample Standard Deviation (s)(s) =…


Trending now
This is a popular solution!

Step by step
Solved in 3 steps with 3 images

- A sales manager collected the following data on annual sales for new customer accounts and the number of years of experience for a sample of 10 salespersons. Years of Annual Sales Salesperson Experience ($1000) 1 2 82 2 3 84 3 4 94 4 6 101 5 7 102 6 9 105 7 10 108 8 11 114 9 13 123 10 15 125 a. Compute the residuals and choose a residual plot for this problem. y= __ + __ x (to 1 decimal) The correct plot of the residuals is (A, B, C, D) b. Do the assumptions about the error term seem reasonable in light of the residual plot? The assumptions concerning the error term (appear, do not appear) reasonable.A researcher wants to examine the relationship between time spend on social media (variable X) and loneliness (variable Y) in young adults. A randomly sample of n = 52 young adults was asked how much time in average they spend on social media each day and how lonely day feel on a typical day. The partial computations of collected data produced the following results: SP = -14 MX = 10 SSx = 36 MY = 16 SSY = 49 A. Based on these results, is there a significant correlation between time spend on social media and loneliness among young adults? Use a Pearson correlation test with p < .05, 2-tails to answer this research question. Follow the steps of hypothesis testing and insert your answers below. In your calculations,round all numbers to two decimal places to avoid rounding errors. ANSWER H0: H1: Computed Pearson r = df for decision about H0: Critical r-value used for decision about H0: Decision about H0 (i.e., reject or fail to…The following data on x=soil depth and y=percentage of montmorillonite in the soil were analyzed from samples taken in Belize X 40 50 60 70 80 90 100 Y 58 34 32 30 28 27 22 Draw the scatterplot Compute and draw the least square regression line. Compute the residual and construct a residual plot. Are there any unusual features of this plot?
- Compute the sum-of-squares error (SSE) by hand for the given set of data and linear model. (4, 4), (7, 7), (9, 10); y = x − 1The following table indicates the ages of a sample of female employees of People Plus Pty, and the corresponding monthly income of each employee (in thousands of Rands). Age In Years (x) 404932273846 Monthly Income (R000s) (y) 434936314142 By completing the table given below, and then applying the relevant formulae, determine the linear regression function for this bivariate data set. X Y X^2 XY TOTAL If a female employee is 39 years of age, estimate her monthly income.Using the LSRL, y hat = -25.5+1.5x, what is the residual for the data point at (28,19)
- The following data represent a company’s yearly sales volume and its advertising expenditure over a period of 5 years. (Y) (X) Sales in Millions Advertising Of Dollars in ($10,000) 15 32 16 33 18 35 17 34 16 36 Develop a scatter diagram of sales versus advertising and explain what it shows regarding the relationship between sales and advertising. Use the method of least squares to compute an estimated regression line between sales and advertising by computing b0 and b1An article reported that for a regression of y = average SAT score on x = expenditure per pupil, based on data from n = 44 New Jersey school districts, a = 766, b = 0.015, r2 = 0.160, and se = 53.7. One observation in the sample was (9400, 897). What average SAT score would you predict for this district, and what is the corresponding residual?Predict average SAT score _______ Residual ________The following data represent a company’s yearly sales volume and its advertising expenditure over a period of 5 years. (Y) (X) Sales in Millions Advertising Of Dollars in ($10,000) 15 32 16 33 18 35 17 34 16 36 Develop a scatter diagram of sales versus advertising and explain what it shows regarding the relationship between sales and advertising. Use the method of least squares to compute an estimated regression line between sales and advertising by computing b0 and b1 If the company’s advertising…
- The following data show the number of class sessions missed during a semester of SOC221 and the final grade for a sample of 8 students selected at random. Number of Sessions Missed Final Grade (x) (y) 0 96 2 88 12 68 6 91 8…Suppose a professor records the number of days absent and the final exam score for the students in his class. Use this data in the table below to answer questions a through d. No. of Absences, x 0 1 2 3 4 Final Exam Score, y 96.5 87.4 88.3 84.2 79.1 1) Predict the final exam score for a student who misses one class period and compute the residual. Is the final exam score above or below average for this number of absences? The predicted final exam score is ? (Round to two decimal places as needed.) The residual is ?A set of n = 15 pairs of X and Y values has a correlation of r = +0.80 with SSY = 75, and the regression equation for predicting Y is computed. Find the standard error of estimate for the regression equation. How big would the standard error be if the sample size were n = 30.
