The following table presents historical unemployment and inflation data in the United States for the years 1964 through 1968. Year Unemployment Rate Inflation Rate (Percent) (Percent) 1964 5.2 1.3 1965 4.5 1.6 1966 3.8 2.9 1967 3.8 3.1 1968 3.6 4.2 Plot the data for these five years on the following graph. Note: You will not be graded on how you plot the points, but plotting the points accurately on the graph will help you examine the relationship between unemployment and inflation during this period and solve the problems that follow. Which of the following statements most accurately describes the relationship between inflation and unemployment in the United States during this time period? -The short-run Phillips curve shifted to the right after actual inflation was higher than expected. -The short-run Phillips curve shifted to the left after actual inflation was lower than expected. -The short-run Phillips curve remained stable. The following graph shows the short-run Phillips curve (SRPC) for the United States in 1964. Drag the dot along the curve, shift the curve, or both to illustrate what happened between 1964 and 1968. The following graph shows the aggregate demand (AD) and short-run aggregate supply (AS) curves for the United States in 1964. Shift the aggregate demand curve to approximate what happened between 1964 and 1968.


The following table presents historical
|
Year |
Unemployment Rate |
Inflation Rate |
|
(Percent) |
(Percent) |
|
|
1964 |
5.2 |
1.3 |
|
1965 |
4.5 |
1.6 |
|
1966 |
3.8 |
2.9 |
|
1967 |
3.8 |
3.1 |
|
1968 |
3.6 |
4.2 |
Plot the data for these five years on the following graph.
Note: You will not be graded on how you plot the points, but plotting the points accurately on the graph will help you examine the relationship between unemployment and inflation during this period and solve the problems that follow.
Which of the following statements most accurately describes the relationship between inflation and unemployment in the United States during this time period?
-The short-run
-The short-run Phillips curve shifted to the left after actual inflation was lower than expected.
-The short-run Phillips curve remained stable.
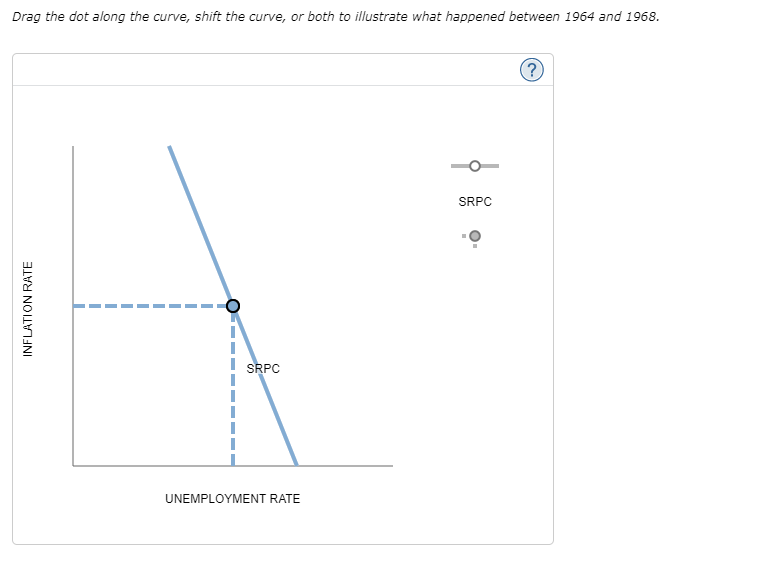
The following graph shows the short-run Phillips curve (SRPC) for the United States in 1964.
Drag the dot along the curve, shift the curve, or both to illustrate what happened between 1964 and 1968.
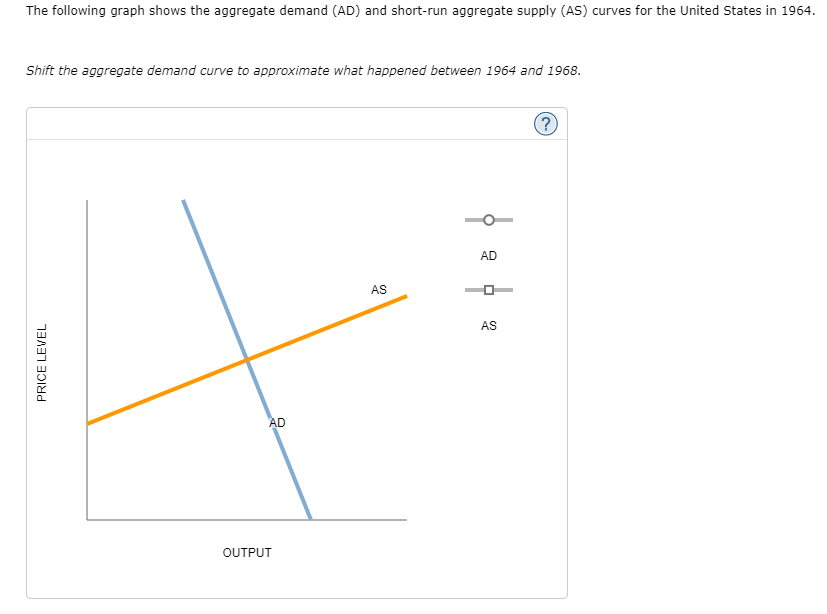
The following graph shows the aggregate demand (AD) and short-run
Shift the aggregate demand curve to approximate what happened between 1964 and 1968.


Trending now
This is a popular solution!

Step by step
Solved in 2 steps with 3 images


