The following table represents the annual rainfall distribution in a city, for a sample of (5X+1) years. Rainfall (in cm) 20 - 25 25 – 30 30 – 35 35 – 40 40 – 45 45 – 50 50 – 55 55 – 60 Number of years 3 X-3 7 2X-6 7 4 2 (X/2) - 1 a. Compute the average rainfall. Answer in exact fraction, or rounded to at least 4 decimal places cm b. Compute the median rainfall. Answer in exact fraction, or rounded to at least 4 decimal places. cm c. Determine the variance value of the rainfall distribution. Answer in exact fraction, or rounded to at least 4 decimal places.
The following table represents the annual rainfall distribution in a city, for a sample of (5X+1) years. Rainfall (in cm) 20 - 25 25 – 30 30 – 35 35 – 40 40 – 45 45 – 50 50 – 55 55 – 60 Number of years 3 X-3 7 2X-6 7 4 2 (X/2) - 1 a. Compute the average rainfall. Answer in exact fraction, or rounded to at least 4 decimal places cm b. Compute the median rainfall. Answer in exact fraction, or rounded to at least 4 decimal places. cm c. Determine the variance value of the rainfall distribution. Answer in exact fraction, or rounded to at least 4 decimal places.

Glencoe Algebra 1, Student Edition, 9780079039897, 0079039898, 2018
18th Edition
ISBN:9780079039897
Author:Carter
Publisher:Carter
Chapter10: Statistics
Section10.6: Summarizing Categorical Data
Problem 31PPS

Related questions
Question

Transcribed Image Text:d. Find the Pearson's Coefficient of Skewness using the relation between Mean, Median and Standard Deviation.
Answer in exact fraction, or rounded to at least 4 decimal places.
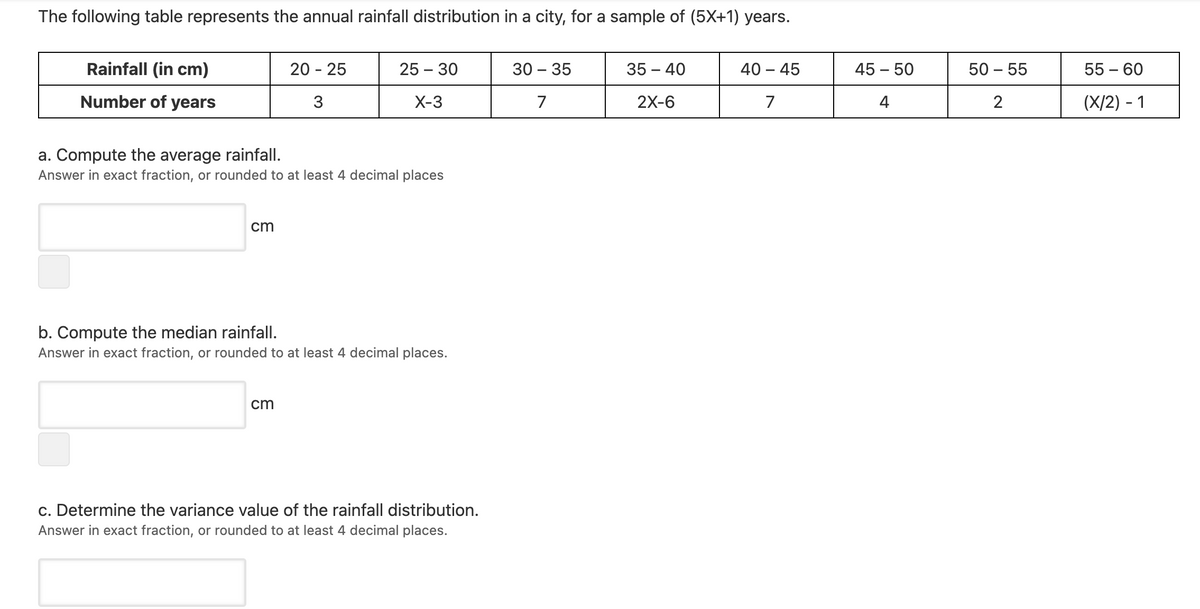
Transcribed Image Text:The following table represents the annual rainfall distribution in a city, for a sample of (5X+1) years.
Rainfall (in cm)
20 - 25
25 – 30
30 – 35
35 – 40
40 – 45
45 – 50
50 – 55
55 – 60
Number of years
3
X-3
7
2X-6
7
4
2
(X/2) - 1
a. Compute the average rainfall.
Answer in exact fraction, or rounded to at least 4 decimal places
cm
b. Compute the median rainfall.
Answer in exact fraction, or rounded to at least 4 decimal places.
cm
c. Determine the variance value of the rainfall distribution.
Answer in exact fraction, or rounded to at least 4 decimal places.
Expert Solution
This question has been solved!
Explore an expertly crafted, step-by-step solution for a thorough understanding of key concepts.

Step by step
Solved in 2 steps with 2 images

Recommended textbooks for you
Glencoe Algebra 1, Student Edition, 9780079039897…
Algebra
ISBN:
9780079039897
Author:
Carter
Publisher:
McGraw Hill
Glencoe Algebra 1, Student Edition, 9780079039897…
Algebra
ISBN:
9780079039897
Author:
Carter
Publisher:
McGraw Hill