The national distribution of fatal work injuries in a country is shown in the table to the right under National %. You believe that Western Frequency D 2892 Cause National % the distribution of fatal work injuries is different in the western part of the country and randomly select 6231 fatal work injuries Transportation occurring in that region. At a = 0.025 can you conclude that the distribution of fatal work injuries in the west is different from the Equipment Assaults Falls Harmful fumes Fires 44% 17% 1160 national distribution? Complete parts a through d below. 14% 804 13% 749 9% 532 3% 94 = 12.833 (Round to three decimal places as needed.) Determine the rejection region. OB. X
The national distribution of fatal work injuries in a country is shown in the table to the right under National %. You believe that Western Frequency D 2892 Cause National % the distribution of fatal work injuries is different in the western part of the country and randomly select 6231 fatal work injuries Transportation occurring in that region. At a = 0.025 can you conclude that the distribution of fatal work injuries in the west is different from the Equipment Assaults Falls Harmful fumes Fires 44% 17% 1160 national distribution? Complete parts a through d below. 14% 804 13% 749 9% 532 3% 94 = 12.833 (Round to three decimal places as needed.) Determine the rejection region. OB. X

Glencoe Algebra 1, Student Edition, 9780079039897, 0079039898, 2018
18th Edition
ISBN:9780079039897
Author:Carter
Publisher:Carter
Chapter10: Statistics
Section10.4: Distributions Of Data
Problem 19PFA

Related questions

Question
(c) Calculate the test statistic.
d) Decide whether to reject or fail to reject the null hypothesis. Then interpret the decision in the context of the original claim.
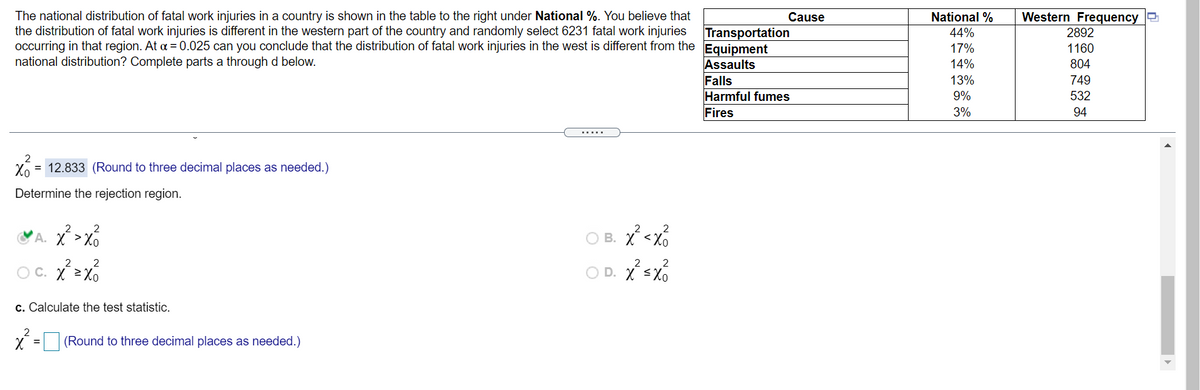
Transcribed Image Text:The national distribution of fatal work injuries in a country is shown in the table to the right under National %. You believe that
the distribution of fatal work injuries is different in the western part of the country and randomly select 6231 fatal work injuries
occurring in that region. At a = 0.025 can you conclude that the distribution of fatal work injuries in the west is different from the
national distribution? Complete parts a through d below.
Cause
National %
Western Frequency 2
Transportation
Equipment
Assaults
Falls
Harmful fumes
Fires
44%
2892
17%
1160
14%
804
13%
9%
749
532
3%
94
.....
2
Xo = 12.833 (Round to three decimal places as needed.)
Determine the rejection region.
2
*A. X >xó
O B. X<x%
2
2
O C. X 2
O D. X <X0
c. Calculate the test statistic.
2
(Round to three decimal places as needed.)
Expert Solution
This question has been solved!
Explore an expertly crafted, step-by-step solution for a thorough understanding of key concepts.

This is a popular solution!

Trending now
This is a popular solution!

Step by step
Solved in 3 steps

Knowledge Booster


Learn more about
Need a deep-dive on the concept behind this application? Look no further. Learn more about this topic, statistics and related others by exploring similar questions and additional content below.Recommended textbooks for you
Glencoe Algebra 1, Student Edition, 9780079039897…
Algebra
ISBN:
9780079039897
Author:
Carter
Publisher:
McGraw Hill
Glencoe Algebra 1, Student Edition, 9780079039897…
Algebra
ISBN:
9780079039897
Author:
Carter
Publisher:
McGraw Hill