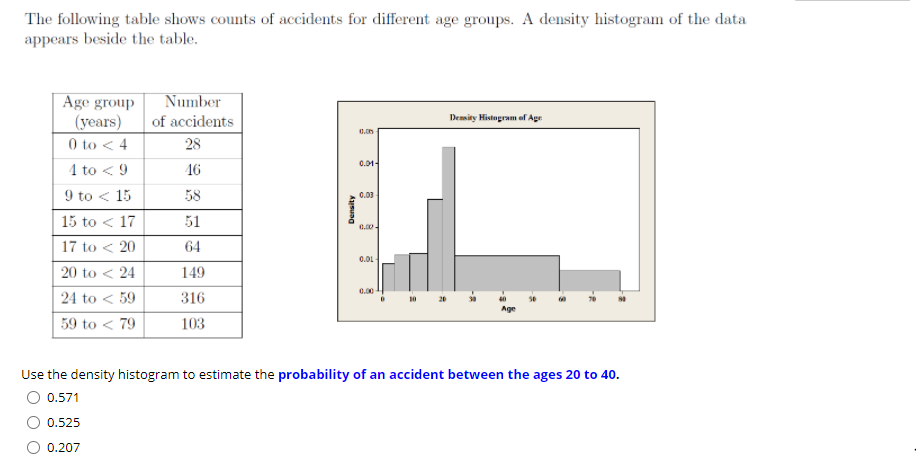
The following table shows counts of accidents for different age groups. A density histogram of the data appears beside the table. Age group (years) 0 to < 4 4 to < 9 Number of accidents Demity Histogram of Age 28 0.01 16 9 to < 15 58 0.00 15 to < 17 51 0.00 17 to < 20 64 0.01- 20 to < 24 149 0.00 24 to < 59 316 59 to < 79 103 Use the density histogram to estimate the probability of an accident between the ages 20 to 40. 0.571 0.525 0.207 Density
The following table shows counts of accidents for different age groups. A density histogram of the data appears beside the table. Age group (years) 0 to < 4 4 to < 9 Number of accidents Demity Histogram of Age 28 0.01 16 9 to < 15 58 0.00 15 to < 17 51 0.00 17 to < 20 64 0.01- 20 to < 24 149 0.00 24 to < 59 316 59 to < 79 103 Use the density histogram to estimate the probability of an accident between the ages 20 to 40. 0.571 0.525 0.207 Density

Glencoe Algebra 1, Student Edition, 9780079039897, 0079039898, 2018
18th Edition
ISBN:9780079039897
Author:Carter
Publisher:Carter
Chapter10: Statistics
Section10.1: Measures Of Center
Problem 9PPS

Related questions
Question
Q3
Transcribed Image Text:The following table shows counts of accidents for different age groups. A density histogram of the data
appears beside the table.
Age group
(years)
0 to < 4
4 to < 9
Number
of accidents
Demity Histogram of Age
28
0.01
16
9 to < 15
58
0.00
15 to < 17
51
0.00
17 to < 20
64
0.01-
20 to < 24
149
0.00
24 to < 59
316
59 to < 79
103
Use the density histogram to estimate the probability of an accident between the ages 20 to 40.
0.571
0.525
0.207
Density
Expert Solution
This question has been solved!
Explore an expertly crafted, step-by-step solution for a thorough understanding of key concepts.

This is a popular solution!

Trending now
This is a popular solution!

Step by step
Solved in 3 steps with 4 images

Knowledge Booster


Learn more about
Need a deep-dive on the concept behind this application? Look no further. Learn more about this topic, statistics and related others by exploring similar questions and additional content below.Recommended textbooks for you
Glencoe Algebra 1, Student Edition, 9780079039897…
Algebra
ISBN:
9780079039897
Author:
Carter
Publisher:
McGraw Hill
Glencoe Algebra 1, Student Edition, 9780079039897…
Algebra
ISBN:
9780079039897
Author:
Carter
Publisher:
McGraw Hill