The following table shows retail sales in drug stores in billions of dollars in the U.S. for years since 1995. Year Retail Sales 0 3 6 9 12 15 Let y be the retail sales in billions of dollars in x years since 1995. A linear model for the data is Y = 9.44x + 84.182. 220 210- 200 190- 180- 170- 160- 150- 140- 130- 120- 110- 100- 90 80+ 85.851 108.426 141.781 169.256 202.297 222.266 3 6 9 12 Use the above scatter plot to decide whether the linear model fits the data well. The function is a good model for the data. O The function is not a good model for the data Estimate the retails sales in the U. S. in 2017. billions of dollars. Use the model to predict the year in which retails sales will be $235 billion.
The following table shows retail sales in drug stores in billions of dollars in the U.S. for years since 1995. Year Retail Sales 0 3 6 9 12 15 Let y be the retail sales in billions of dollars in x years since 1995. A linear model for the data is Y = 9.44x + 84.182. 220 210- 200 190- 180- 170- 160- 150- 140- 130- 120- 110- 100- 90 80+ 85.851 108.426 141.781 169.256 202.297 222.266 3 6 9 12 Use the above scatter plot to decide whether the linear model fits the data well. The function is a good model for the data. O The function is not a good model for the data Estimate the retails sales in the U. S. in 2017. billions of dollars. Use the model to predict the year in which retails sales will be $235 billion.

Algebra & Trigonometry with Analytic Geometry
13th Edition
ISBN:9781133382119
Author:Swokowski
Publisher:Swokowski
Chapter7: Analytic Trigonometry
Section7.6: The Inverse Trigonometric Functions
Problem 91E

Related questions
Question
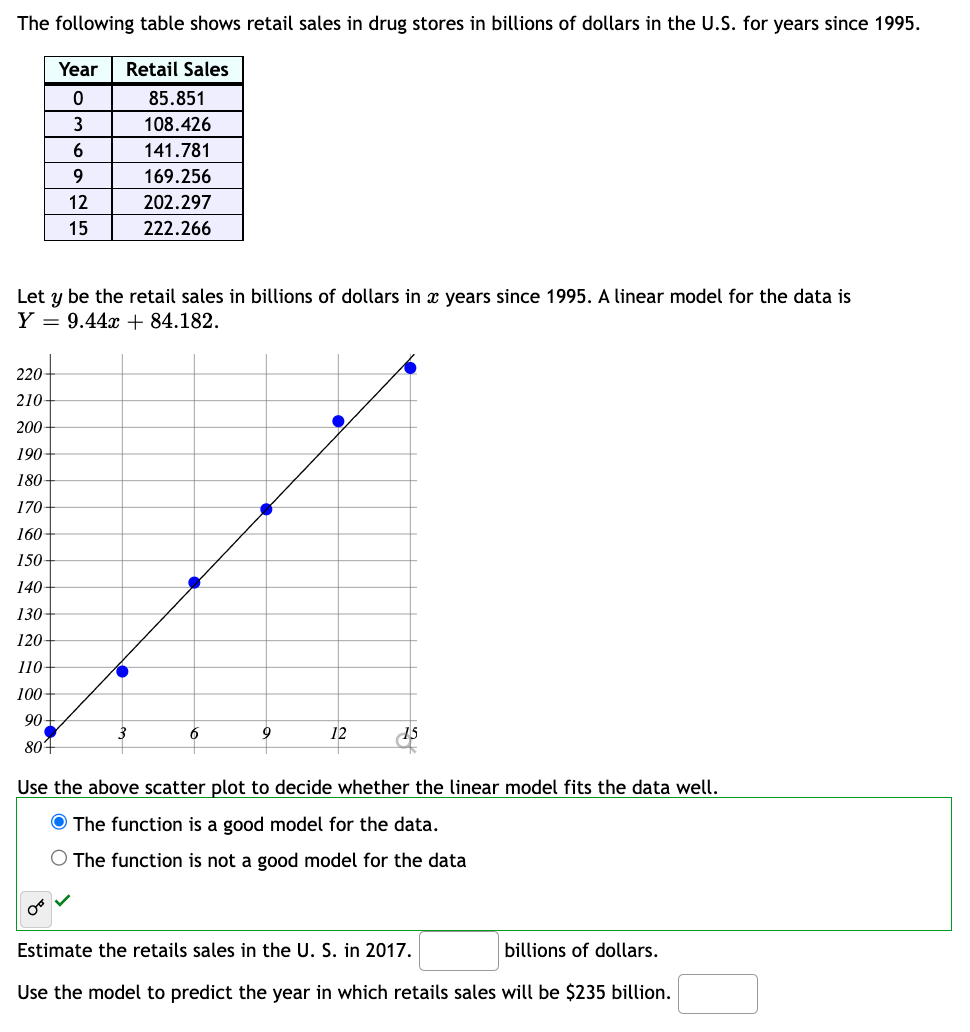
Transcribed Image Text:The following table shows retail sales in drug stores in billions of dollars in the U.S. for years since 1995.
220-
210-
200
190-
180-
170-
160-
150-
140-
130-
120-
110
100
Year Retail Sales
0
3
6
9
12
15
Let y be the retail sales in billions of dollars in x years since 1995. A linear model for the data is
Y = 9.44x + 84.182.
90-
80¹
85.851
108.426
141.781
169.256
202.297
222.266
6
9
12
Use the above scatter plot to decide whether the linear model fits the data well.
The function is a good model for the data.
O The function is not a good model for the data
Estimate the retails sales in the U. S. in 2017.
billions of dollars.
Use the model to predict the year in which retails sales will be $235 billion.
Expert Solution
This question has been solved!
Explore an expertly crafted, step-by-step solution for a thorough understanding of key concepts.

This is a popular solution!

Trending now
This is a popular solution!

Step by step
Solved in 2 steps

Recommended textbooks for you
Algebra & Trigonometry with Analytic Geometry
Algebra
ISBN:
9781133382119
Author:
Swokowski
Publisher:
Cengage


Functions and Change: A Modeling Approach to Coll…
Algebra
ISBN:
9781337111348
Author:
Bruce Crauder, Benny Evans, Alan Noell
Publisher:
Cengage Learning
Algebra & Trigonometry with Analytic Geometry
Algebra
ISBN:
9781133382119
Author:
Swokowski
Publisher:
Cengage
Functions and Change: A Modeling Approach to Coll…
Algebra
ISBN:
9781337111348
Author:
Bruce Crauder, Benny Evans, Alan Noell
Publisher:
Cengage Learning