The following table shows the length, in centimeters, of the humerus and the total wingspan, in centimeters, of several pterosaurs, which are extinct flying reptiles. (A graphing calculator is recommended. Pterosaur Data Humerus, x Wingspan, y Humerus, x Wingspan, y 25 589 26 596 30 598 32 599 24 536 22 532 21 529 20 473 18 465 15 443 1.4 38 1.1 35 1.0 35 0.9 28 0.8 24 (a) Find the equation of the least-squares regression line for the data. Round constants to the nearest hundredth. (b) Use the equation from part (a) to determine, to the nearest centimeter, the projected wingspan of a pterosaur if its humerus is 50 centimeters. cm
The following table shows the length, in centimeters, of the humerus and the total wingspan, in centimeters, of several pterosaurs, which are extinct flying reptiles. (A graphing calculator is recommended. Pterosaur Data Humerus, x Wingspan, y Humerus, x Wingspan, y 25 589 26 596 30 598 32 599 24 536 22 532 21 529 20 473 18 465 15 443 1.4 38 1.1 35 1.0 35 0.9 28 0.8 24 (a) Find the equation of the least-squares regression line for the data. Round constants to the nearest hundredth. (b) Use the equation from part (a) to determine, to the nearest centimeter, the projected wingspan of a pterosaur if its humerus is 50 centimeters. cm

Glencoe Algebra 1, Student Edition, 9780079039897, 0079039898, 2018
18th Edition
ISBN:9780079039897
Author:Carter
Publisher:Carter
Chapter10: Statistics
Section10.6: Summarizing Categorical Data
Problem 34PPS

Related questions
Topic Video
Question
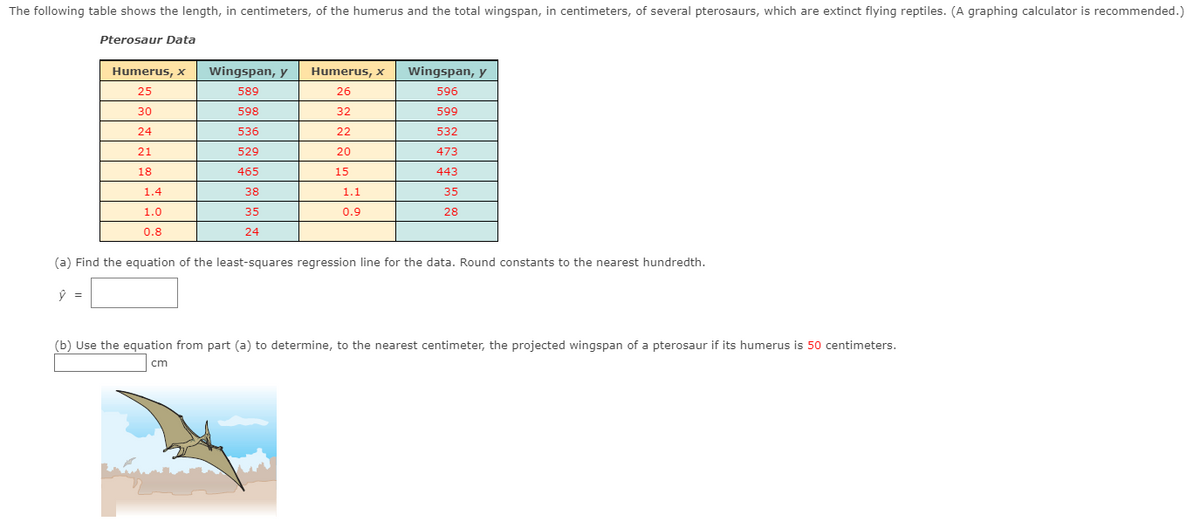
Transcribed Image Text:The following table shows the length, in centimeters, of the humerus and the total wingspan, in centimeters, of several pterosaurs, which are extinct flying reptiles. (A graphing calculator is recommended.)
Pterosaur Data
Humerus, x
Wingspan, y
Humerus, x
Wingspan, y
25
589
26
596
30
598
32
599
24
536
22
532
21
529
20
473
18
465
15
443
1.4
38
1.1
35
1.0
35
0.9
28
0.8
24
(a) Find the equation of the least-squares regression line for the data. Round constants to the nearest hundredth.
(b) Use the equation from part (a) to determine, to the nearest centimeter, the projected wingspan of a pterosaur if its humerus is 50 centimeters.
cm
Expert Solution
This question has been solved!
Explore an expertly crafted, step-by-step solution for a thorough understanding of key concepts.

This is a popular solution!

Trending now
This is a popular solution!

Step by step
Solved in 4 steps

Knowledge Booster


Learn more about
Need a deep-dive on the concept behind this application? Look no further. Learn more about this topic, statistics and related others by exploring similar questions and additional content below.Recommended textbooks for you
Glencoe Algebra 1, Student Edition, 9780079039897…
Algebra
ISBN:
9780079039897
Author:
Carter
Publisher:
McGraw Hill
Glencoe Algebra 1, Student Edition, 9780079039897…
Algebra
ISBN:
9780079039897
Author:
Carter
Publisher:
McGraw Hill