2. The data table to the right represents the volumes of a generic soda brand. Volumes of soda (oz) Complete parts (a) and (b) below. 75 70 70 80 65 b 70 75 70 75 70 80 85 65 50 a. Which plot represents a dotplot of the data? O A. OB. 50 60 70 80 90 50 60 70 80 90 Volumes of soda (oz) Volumes of soda (oz) Oc. OD. 50 60 70 80 50 60 70 80 90 Volumes of soda (oz) Volumes of soda (oz) b. Are there any outliers? O A. Yes, the volume of 70 oz appears to be an outlier because many sodas had this as their volume. O B. Yes, the volumes of 0 oz and 200 oz appear to be outliers because they are far away from the other temperatures. O C. No, there do not appear to be any outliers. D. Yes, the volume of 50 oz appears to be an outlier because it is far away from the other volumes. 1A
2. The data table to the right represents the volumes of a generic soda brand. Volumes of soda (oz) Complete parts (a) and (b) below. 75 70 70 80 65 b 70 75 70 75 70 80 85 65 50 a. Which plot represents a dotplot of the data? O A. OB. 50 60 70 80 90 50 60 70 80 90 Volumes of soda (oz) Volumes of soda (oz) Oc. OD. 50 60 70 80 50 60 70 80 90 Volumes of soda (oz) Volumes of soda (oz) b. Are there any outliers? O A. Yes, the volume of 70 oz appears to be an outlier because many sodas had this as their volume. O B. Yes, the volumes of 0 oz and 200 oz appear to be outliers because they are far away from the other temperatures. O C. No, there do not appear to be any outliers. D. Yes, the volume of 50 oz appears to be an outlier because it is far away from the other volumes. 1A

Algebra & Trigonometry with Analytic Geometry
13th Edition
ISBN:9781133382119
Author:Swokowski
Publisher:Swokowski
Chapter7: Analytic Trigonometry
Section7.6: The Inverse Trigonometric Functions
Problem 93E

Related questions
Question
Transcribed Image Text:2.
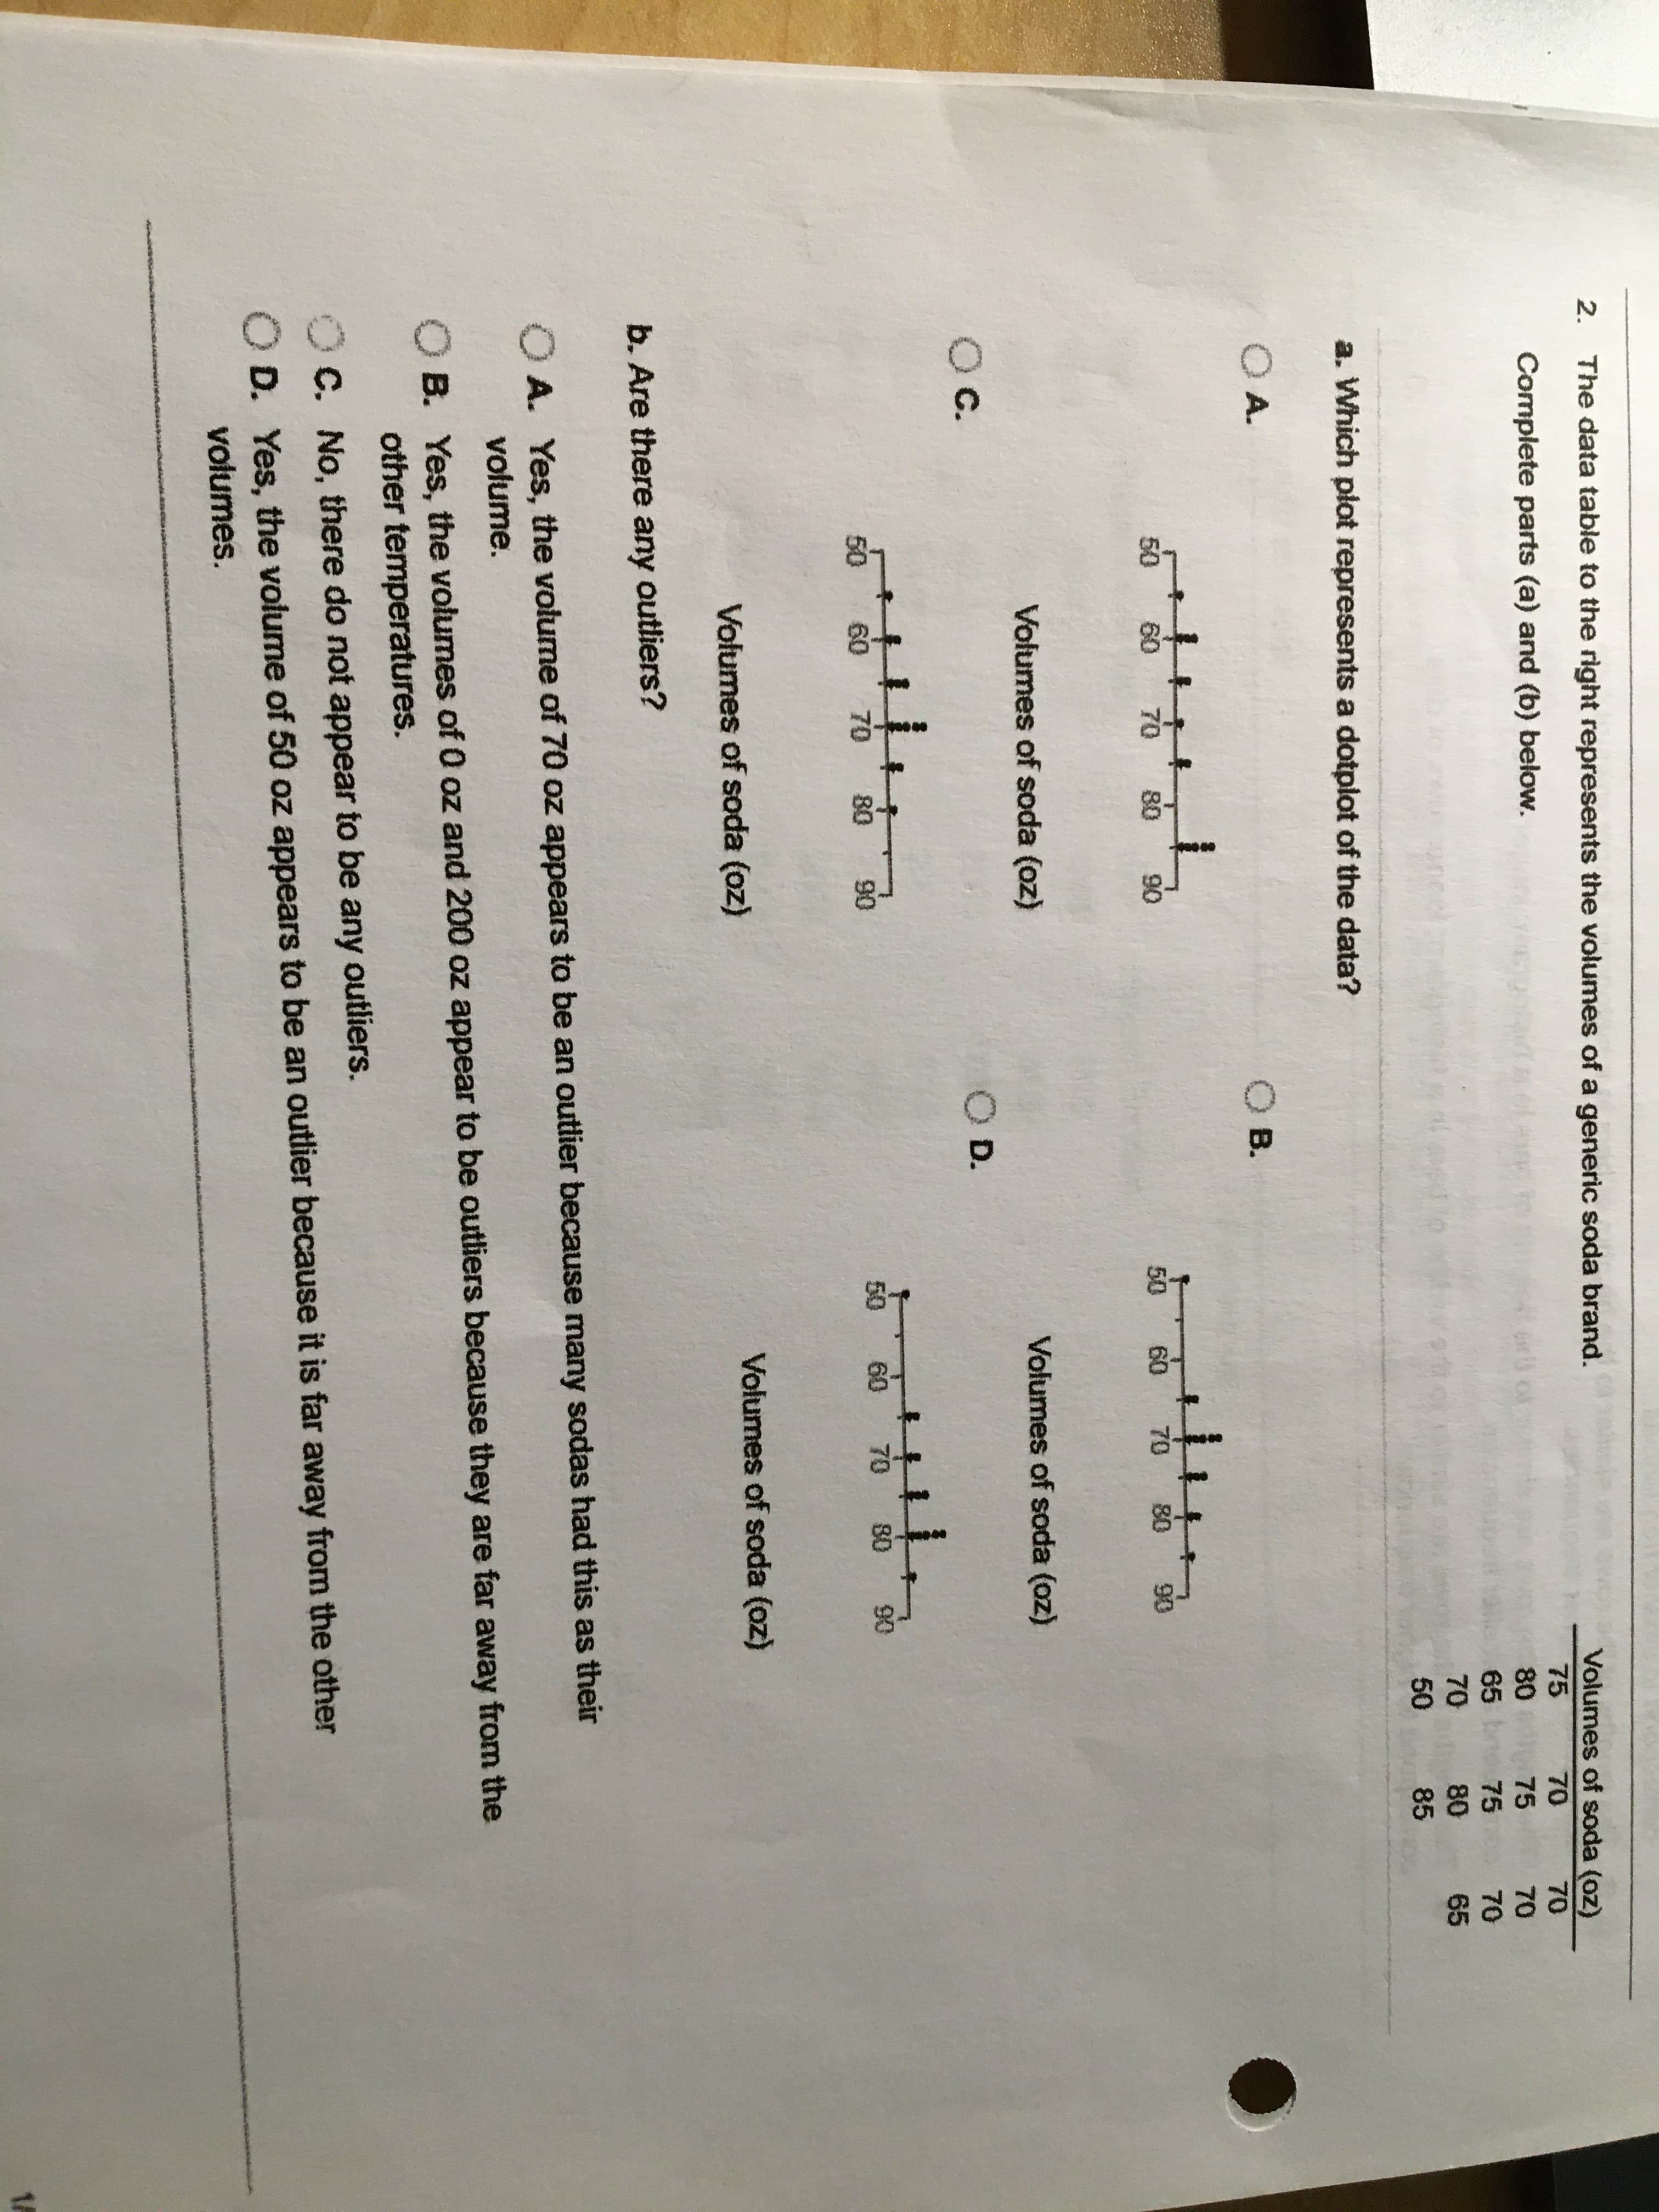
The data table to the right represents the volumes of a generic soda brand.
Volumes of soda (oz)
Complete parts (a) and (b) below.
75
70
70
80
65 b
70
75
70
75
70
80
85
65
50
a. Which plot represents a dotplot of the data?
O A.
OB.
50
60 70
80
90
50
60
70
80
90
Volumes of soda (oz)
Volumes of soda (oz)
Oc.
OD.
50
60
70
80
50
60
70
80
90
Volumes of soda (oz)
Volumes of soda (oz)
b. Are there any outliers?
O A. Yes, the volume of 70 oz appears to be an outlier because many sodas had this as their
volume.
O B. Yes, the volumes of 0 oz and 200 oz appear to be outliers because they are far away from the
other temperatures.
O C. No, there do not appear to be any outliers.
D. Yes, the volume of 50 oz appears to be an outlier because it is far away from the other
volumes.
1A
Expert Solution
This question has been solved!
Explore an expertly crafted, step-by-step solution for a thorough understanding of key concepts.

This is a popular solution!

Trending now
This is a popular solution!

Step by step
Solved in 2 steps with 1 images

Recommended textbooks for you
Algebra & Trigonometry with Analytic Geometry
Algebra
ISBN:
9781133382119
Author:
Swokowski
Publisher:
Cengage

Glencoe Algebra 1, Student Edition, 9780079039897…
Algebra
ISBN:
9780079039897
Author:
Carter
Publisher:
McGraw Hill

Functions and Change: A Modeling Approach to Coll…
Algebra
ISBN:
9781337111348
Author:
Bruce Crauder, Benny Evans, Alan Noell
Publisher:
Cengage Learning
Algebra & Trigonometry with Analytic Geometry
Algebra
ISBN:
9781133382119
Author:
Swokowski
Publisher:
Cengage
Glencoe Algebra 1, Student Edition, 9780079039897…
Algebra
ISBN:
9780079039897
Author:
Carter
Publisher:
McGraw Hill
Functions and Change: A Modeling Approach to Coll…
Algebra
ISBN:
9781337111348
Author:
Bruce Crauder, Benny Evans, Alan Noell
Publisher:
Cengage Learning