The following table shows the number of fiber optic cable connections to homes in a country from 2000 to 2004 (t = 0 represents 2000). Year t o 1 2 3 4 Connections c s15 3o 70 155 (Thousands) (a) Use technology to obtain the linear regression line and the correlation coefficient r, with all coefficients rounded to two decimal places. c(t) = Plot the regression line and the given points. 100 100 (b) Does the graph suggest that a nonlinear relationship between t and c would be more appropriate than a linear one? Why? Yes, the first and last points lie above the regression line, while the central points lie below it, suggesting a nonlinear relationship. No, the points appear to be randomly scattered about the regression line which does not imply a nonlinear relationship. (C) Use technology to obtain the residuals. (Round your answers to two decimal places.) Year t Residual 1 2 3 4 What can you say about the residuals in support of the claim in part (b)? The residuals vary from positive to negative with no observable pattern, confirming the impression from the graph. The residuals are positive at first, become negative, and then become positive, confirming the impression from the graph.
The following table shows the number of fiber optic cable connections to homes in a country from 2000 to 2004 (t = 0 represents 2000). Year t o 1 2 3 4 Connections c s15 3o 70 155 (Thousands) (a) Use technology to obtain the linear regression line and the correlation coefficient r, with all coefficients rounded to two decimal places. c(t) = Plot the regression line and the given points. 100 100 (b) Does the graph suggest that a nonlinear relationship between t and c would be more appropriate than a linear one? Why? Yes, the first and last points lie above the regression line, while the central points lie below it, suggesting a nonlinear relationship. No, the points appear to be randomly scattered about the regression line which does not imply a nonlinear relationship. (C) Use technology to obtain the residuals. (Round your answers to two decimal places.) Year t Residual 1 2 3 4 What can you say about the residuals in support of the claim in part (b)? The residuals vary from positive to negative with no observable pattern, confirming the impression from the graph. The residuals are positive at first, become negative, and then become positive, confirming the impression from the graph.

College Algebra
7th Edition
ISBN:9781305115545
Author:James Stewart, Lothar Redlin, Saleem Watson
Publisher:James Stewart, Lothar Redlin, Saleem Watson
Chapter1: Equations And Graphs
Section: Chapter Questions
Problem 10T: Olympic Pole Vault The graph in Figure 7 indicates that in recent years the winning Olympic men’s...

Related questions

Topic Video
Question
Help me to solve this problem please. Thank You
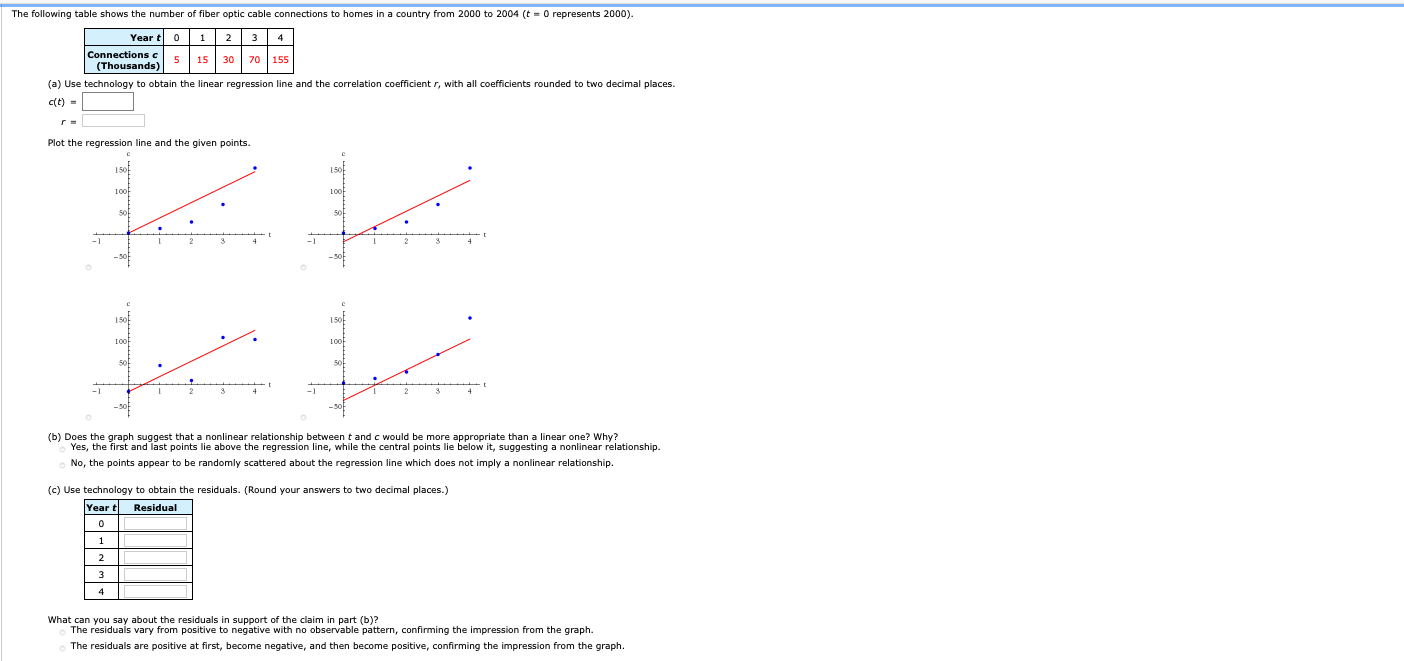
Transcribed Image Text:The following table shows the number of fiber optic cable connections to homes in a country from 2000 to 2004 (t = 0 represents 2000).
Year t o 1 2 3 4
Connections c s15 3o 70 155
(Thousands)
(a) Use technology to obtain the linear regression line and the correlation coefficient r, with all coefficients rounded to two decimal places.
c(t) =
Plot the regression line and the given points.
100
100
(b) Does the graph suggest that a nonlinear relationship between t and c would be more appropriate than a linear one? Why?
Yes, the first and last points lie above the regression line, while the central points lie below it, suggesting a nonlinear relationship.
No, the points appear to be randomly scattered about the regression line which does not imply a nonlinear relationship.
(C) Use technology to obtain the residuals. (Round your answers to two decimal places.)
Year t Residual
1
2
3
4
What can you say about the residuals in support of the claim in part (b)?
The residuals vary from positive to negative with no observable pattern, confirming the impression from the graph.
The residuals are positive at first, become negative, and then become positive, confirming the impression from the graph.
Expert Solution
This question has been solved!
Explore an expertly crafted, step-by-step solution for a thorough understanding of key concepts.

This is a popular solution!

Trending now
This is a popular solution!

Step by step
Solved in 3 steps with 3 images

Knowledge Booster


Learn more about
Need a deep-dive on the concept behind this application? Look no further. Learn more about this topic, statistics and related others by exploring similar questions and additional content below.Recommended textbooks for you
College Algebra
Algebra
ISBN:
9781305115545
Author:
James Stewart, Lothar Redlin, Saleem Watson
Publisher:
Cengage Learning

Glencoe Algebra 1, Student Edition, 9780079039897…
Algebra
ISBN:
9780079039897
Author:
Carter
Publisher:
McGraw Hill
College Algebra
Algebra
ISBN:
9781305115545
Author:
James Stewart, Lothar Redlin, Saleem Watson
Publisher:
Cengage Learning
Glencoe Algebra 1, Student Edition, 9780079039897…
Algebra
ISBN:
9780079039897
Author:
Carter
Publisher:
McGraw Hill