The following table shows the square errors, Fill the table by calculating the root mean square error (RMSE) for each of the methods. Year 2005 2006 07 2008 2009 RMSE Moving Average (5-year) 625 25 1,600 4,900 7,225 Square Error (3-year) 9 289 1,444 4,624 5,329 (Y-Ý... -1)². for forecasts from 2005 through 2009 Three-year moving average Based on the RMSE criterion, which of the forecasting methods is the most accurate? Exponential smoothing (w = 0.3) Five-year moving average Exponential smoothing (w = 0.9) Exponential Smoothing (W = 0.9) (W = 0.3) 16 484 225 0 2,304 2,500 2,025 5,625 1,156 6,724
The following table shows the square errors, Fill the table by calculating the root mean square error (RMSE) for each of the methods. Year 2005 2006 07 2008 2009 RMSE Moving Average (5-year) 625 25 1,600 4,900 7,225 Square Error (3-year) 9 289 1,444 4,624 5,329 (Y-Ý... -1)². for forecasts from 2005 through 2009 Three-year moving average Based on the RMSE criterion, which of the forecasting methods is the most accurate? Exponential smoothing (w = 0.3) Five-year moving average Exponential smoothing (w = 0.9) Exponential Smoothing (W = 0.9) (W = 0.3) 16 484 225 0 2,304 2,500 2,025 5,625 1,156 6,724

Functions and Change: A Modeling Approach to College Algebra (MindTap Course List)
6th Edition
ISBN:9781337111348
Author:Bruce Crauder, Benny Evans, Alan Noell
Publisher:Bruce Crauder, Benny Evans, Alan Noell
Chapter5: A Survey Of Other Common Functions
Section5.3: Modeling Data With Power Functions
Problem 6E: Urban Travel Times Population of cities and driving times are related, as shown in the accompanying...

Related questions
Question
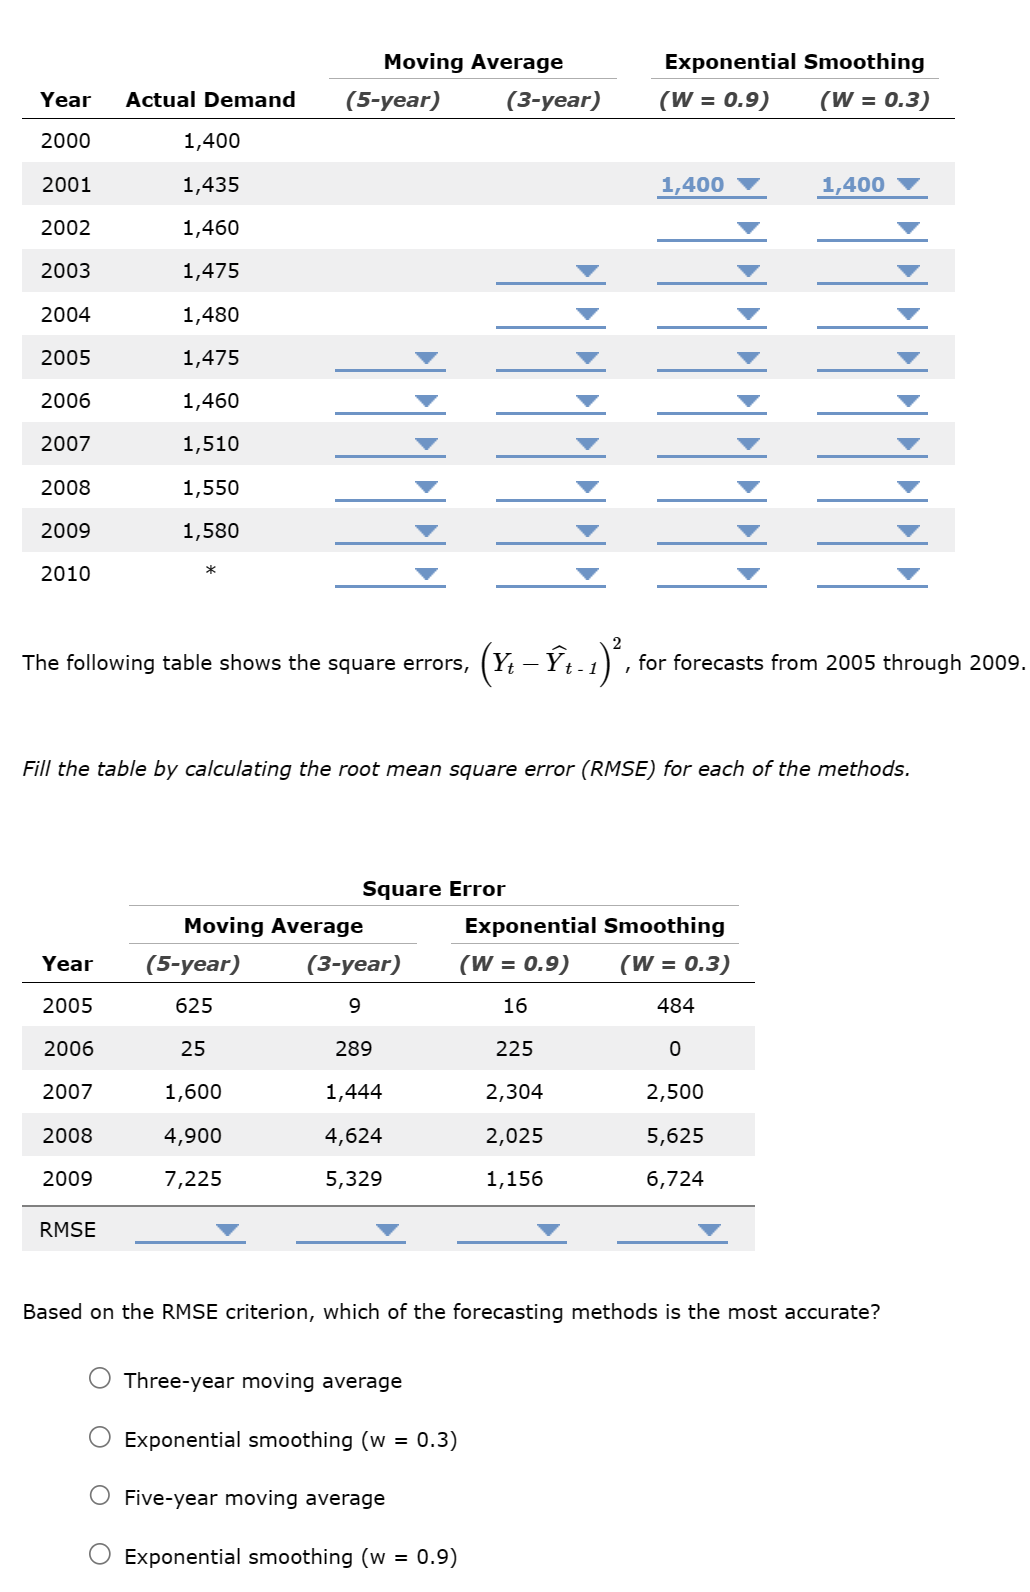
Transcribed Image Text:Year Actual Demand
2000
2001
2002
2003
2004
2005
2006
2007
2008
2009
2010
1,400
1,435
1,460
1,475
1,480
1,475
1,460
1,510
1,550
1,580
Year
2005
2006
2007
2008
2009
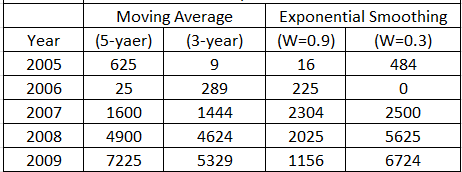
The following table shows the square errors,
RMSE
Moving Average
(5-year)
(5-year)
625
25
1,600
4,900
7,225
Moving Average
Square Error
Fill the table by calculating the root mean square error (RMSE) for each of the methods.
(3-year)
9
289
1,444
4,624
5,329
(3-year)
(Y-Ý..),
Three-year moving average
Exponential smoothing (w = 0.3)
Five-year moving average
Exponential smoothing (w = 0.9)
Exponential Smoothing
(W = 0.9) (W = 0.3)
1,400
1,400
t- for forecasts from 2005 through 2009.
Exponential Smoothing
(W = 0.9)
(W = 0.3)
16
484
225
0
2,304
2,500
2,025
5,625
1,156
6,724
Based on the RMSE criterion, which of the forecasting methods is the most accurate?
Expert Solution
Step 1
The given square errors for the forecasted period of 2005 to 2009 for the considered forecast models are given as:

Step by step
Solved in 2 steps with 1 images

Recommended textbooks for you
Functions and Change: A Modeling Approach to Coll…
Algebra
ISBN:
9781337111348
Author:
Bruce Crauder, Benny Evans, Alan Noell
Publisher:
Cengage Learning

Linear Algebra: A Modern Introduction
Algebra
ISBN:
9781285463247
Author:
David Poole
Publisher:
Cengage Learning
Functions and Change: A Modeling Approach to Coll…
Algebra
ISBN:
9781337111348
Author:
Bruce Crauder, Benny Evans, Alan Noell
Publisher:
Cengage Learning
Linear Algebra: A Modern Introduction
Algebra
ISBN:
9781285463247
Author:
David Poole
Publisher:
Cengage Learning