The following table shows the weekly demand and supply in the market for ice cream in Detroit. dy Tools Price Quantity Demanded Quantity Supplied (Dollars per gallon of ice cream) (Gallons of ice cream) (Gallons of ice cream) 4 2,000 200 Tips 8 1,600 600 12 1,200 800 Tips 16 800 1,200 20 400 1,800 OU On the following graph, plot the demand for ice cream ușing the blue point (circle symbol). Next, plot the supply of ice cream using the orange point (square symbol). Finally, use the black point (plus symbol) to indicate the equilibrium price and quantity in the market for ice cream. g Note: Plot your points in the order in which you would like them connected. Line segments will connect the points automatically. 24 Demand 20 16 Supply MacBook Ai per gallon of ice cream)
The following table shows the weekly demand and supply in the market for ice cream in Detroit. dy Tools Price Quantity Demanded Quantity Supplied (Dollars per gallon of ice cream) (Gallons of ice cream) (Gallons of ice cream) 4 2,000 200 Tips 8 1,600 600 12 1,200 800 Tips 16 800 1,200 20 400 1,800 OU On the following graph, plot the demand for ice cream ușing the blue point (circle symbol). Next, plot the supply of ice cream using the orange point (square symbol). Finally, use the black point (plus symbol) to indicate the equilibrium price and quantity in the market for ice cream. g Note: Plot your points in the order in which you would like them connected. Line segments will connect the points automatically. 24 Demand 20 16 Supply MacBook Ai per gallon of ice cream)

Chapter4: Supply And Demand: An Initial Look
Section: Chapter Questions
Problem 2TY

Related questions
Question
100%
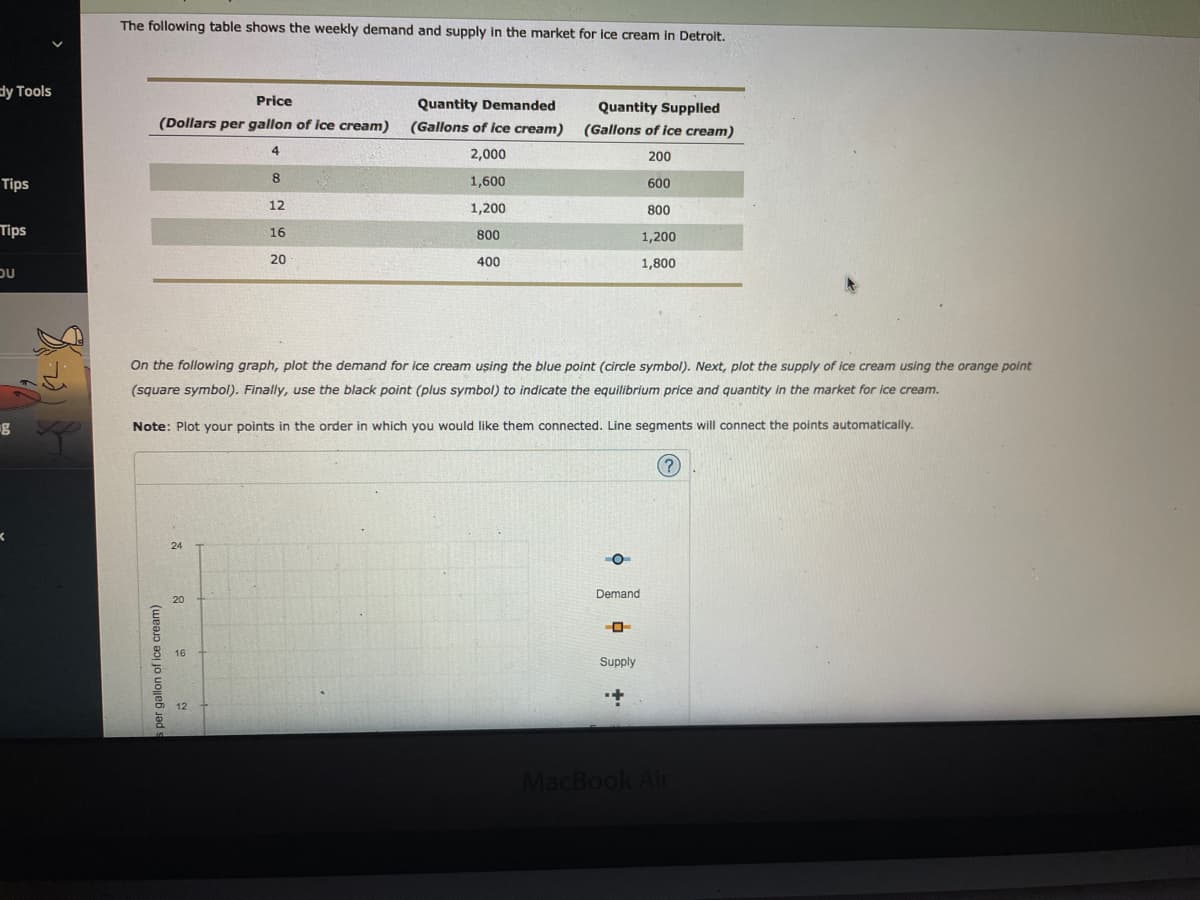
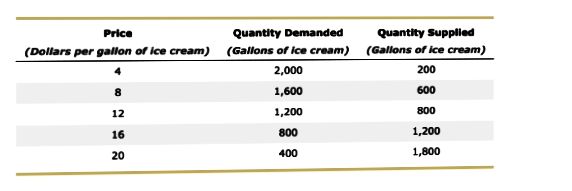
Transcribed Image Text:The following table shows the weekly demand and supply in the market for ice cream in Detroit.
dy Tools
Price
Quantity Demanded
Quantity Supplied
(Dollars per gallon of ice cream)
(Gallons of ice cream)
(Gallons of ice cream)
4
2,000
200
Tips
1,600
600
12
1,200
800
Tips
16
800
1,200
20
400
1,800
כ
On the following graph, plot the demand for ice cream ușing the blue point (circle symbol). Next, plot the supply of ice cream using the orange point
(square symbol). Finally, use the black point (plus symbol) to indicate the equilibrium price and quantity in the market for ice cream.
g
Note: Plot your points in the order in which you would like them connected. Line segments will connect the points automatically.
24
Demand
20
16
Supply
12
MacBook Air
per gallon of ice cream)
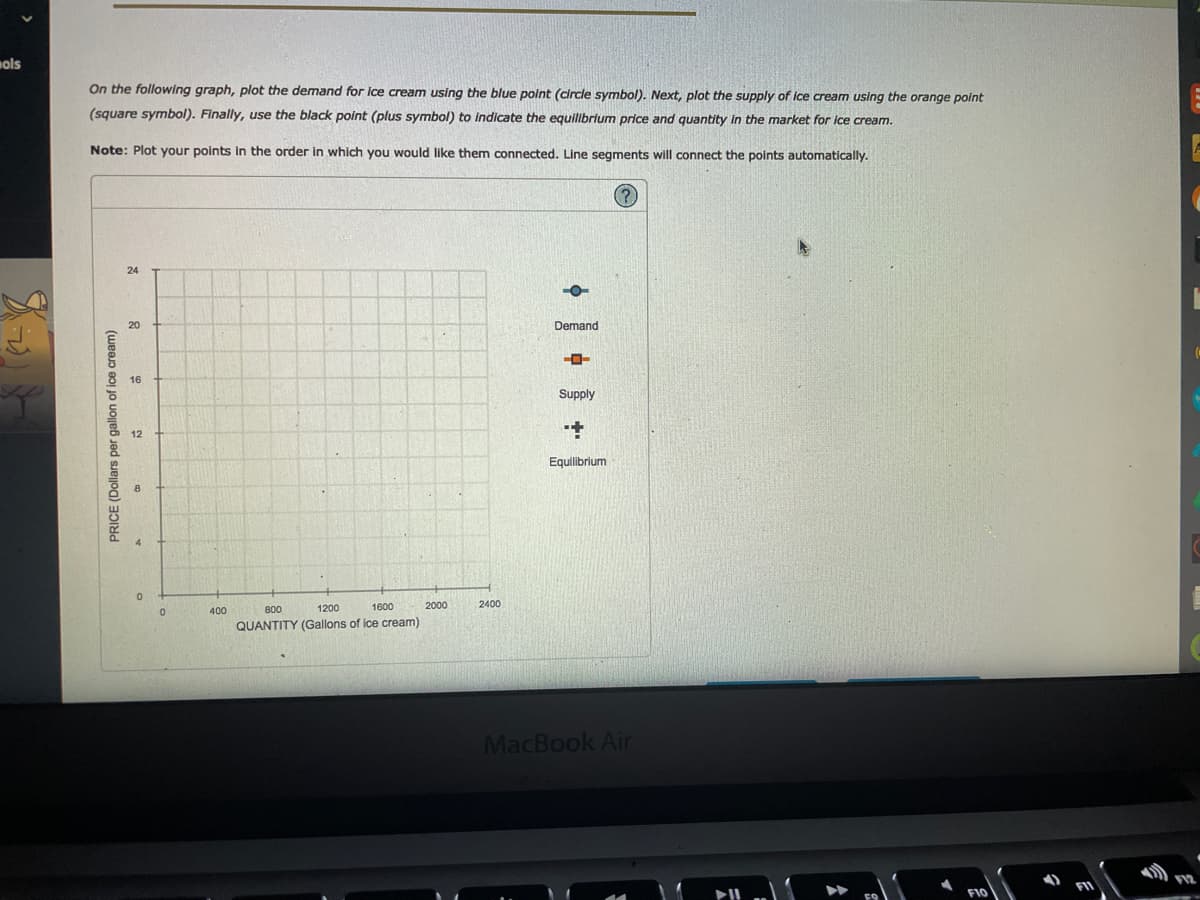
Transcribed Image Text:ols
On the following graph, plot the demand for ice cream using the blue polnt (circle symbol). Next, plot the supply of ice cream using the orange point
(square symbol). Finally, use the black point (plus symnbol) to indicate the equilibrium price and quantity In the market for ice cream.
Note: Plot your points in the order in which you would like them connected. Line segments will connect the points automatically.
(?
24
20
Demand
16
Supply
800
1200
1600
2000
2400
400
QUANTITY (Gallons of ice cream)
MacBook Air
PRICE (Dollars per gallon of ice cream)
Expert Solution
Step 1
* ANSWER :-
Given that ,

Trending now
This is a popular solution!

Step by step
Solved in 3 steps with 2 images

Knowledge Booster


Learn more about
Need a deep-dive on the concept behind this application? Look no further. Learn more about this topic, economics and related others by exploring similar questions and additional content below.Recommended textbooks for you

Exploring Economics
Economics
ISBN:
9781544336329
Author:
Robert L. Sexton
Publisher:
SAGE Publications, Inc

Exploring Economics
Economics
ISBN:
9781544336329
Author:
Robert L. Sexton
Publisher:
SAGE Publications, Inc

Economics (MindTap Course List)
Economics
ISBN:
9781337617383
Author:
Roger A. Arnold
Publisher:
Cengage Learning

Principles of Economics 2e
Economics
ISBN:
9781947172364
Author:
Steven A. Greenlaw; David Shapiro
Publisher:
OpenStax

Essentials of Economics (MindTap Course List)
Economics
ISBN:
9781337091992
Author:
N. Gregory Mankiw
Publisher:
Cengage Learning