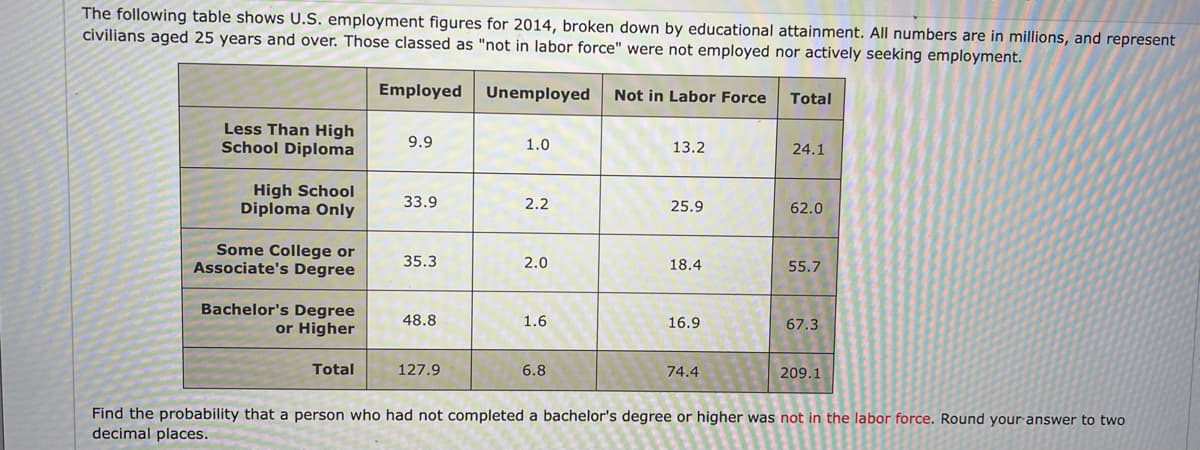
The following table shows U.S. employment figures for 2014, broken down by educational attainment. All numbers are in millions, and represent civilians aged 25 years and over. Those classed as "not in labor force" were not employed nor actively seeking employment. Employed Unemployed Not in Labor Force Total Less Than High School Diploma 9.9 1.0 13.2 24.1 High School Diploma Only 33.9 2.2 25.9 62.0 Some College or Associate's Degree 35.3 2.0 18.4 55.7 Bachelor's Degree or Higher 48.8 1.6 16.9 67.3 Total 127.9 6.8 74.4 209.1 Find the probability that a person who had not completed a bachelor's degree or higher was not in the labor force. Round your answer to two decimal places.
The following table shows U.S. employment figures for 2014, broken down by educational attainment. All numbers are in millions, and represent civilians aged 25 years and over. Those classed as "not in labor force" were not employed nor actively seeking employment. Employed Unemployed Not in Labor Force Total Less Than High School Diploma 9.9 1.0 13.2 24.1 High School Diploma Only 33.9 2.2 25.9 62.0 Some College or Associate's Degree 35.3 2.0 18.4 55.7 Bachelor's Degree or Higher 48.8 1.6 16.9 67.3 Total 127.9 6.8 74.4 209.1 Find the probability that a person who had not completed a bachelor's degree or higher was not in the labor force. Round your answer to two decimal places.

Holt Mcdougal Larson Pre-algebra: Student Edition 2012
1st Edition
ISBN:9780547587776
Author:HOLT MCDOUGAL
Publisher:HOLT MCDOUGAL
Chapter11: Data Analysis And Probability
Section11.5: Interpreting Data
Problem 1C

Related questions
Question
Transcribed Image Text:The following table shows U.S. employment figures for 2014, broken down by educational attainment. All numbers are in millions, and represent
civilians aged 25 years and over. Those classed as "not in labor force" were not employed nor actively seeking employment.
Employed
Unemployed
Not in Labor Force
Total
Less Than High
School Diploma
9.9
1.0
13.2
24.1
High School
Diploma Only
33.9
2.2
25.9
62.0
Some College or
Associate's Degree
35.3
2.0
18.4
55.7
Bachelor's Degree
or Higher
48.8
1.6
16.9
67.3
Total
127.9
6.8
74.4
209.1
Find the probability that a person who had not completed a bachelor's degree or higher was not in the labor force. Round your answer to two
decimal places.
Expert Solution
This question has been solved!
Explore an expertly crafted, step-by-step solution for a thorough understanding of key concepts.

This is a popular solution!

Trending now
This is a popular solution!

Step by step
Solved in 2 steps with 2 images

Recommended textbooks for you
Holt Mcdougal Larson Pre-algebra: Student Edition…
Algebra
ISBN:
9780547587776
Author:
HOLT MCDOUGAL
Publisher:
HOLT MCDOUGAL
Holt Mcdougal Larson Pre-algebra: Student Edition…
Algebra
ISBN:
9780547587776
Author:
HOLT MCDOUGAL
Publisher:
HOLT MCDOUGAL