The pass completion percentages of 10 college football quarterbacks for their freshman and sophomore seasons are shown in the table below. At a = 0.05, is there enough evidence to support the claim that the pass completion percentages have changed? Complete parts (a) through (e) below. Player Completion percentage (freshman) Completion percentage |(sophomore) 1 2 3 4 5 67.4 62.1 56.759.0 64.7 50.0|56.0 64.8 55.2 57.7 6 7 8| 9 | 10 0 67.0 58.1 62.9 59.5 63.4 57.6 61.2 63.8 56.9 59.6
The pass completion percentages of 10 college football quarterbacks for their freshman and sophomore seasons are shown in the table below. At a = 0.05, is there enough evidence to support the claim that the pass completion percentages have changed? Complete parts (a) through (e) below. Player Completion percentage (freshman) Completion percentage |(sophomore) 1 2 3 4 5 67.4 62.1 56.759.0 64.7 50.0|56.0 64.8 55.2 57.7 6 7 8| 9 | 10 0 67.0 58.1 62.9 59.5 63.4 57.6 61.2 63.8 56.9 59.6

Holt Mcdougal Larson Pre-algebra: Student Edition 2012
1st Edition
ISBN:9780547587776
Author:HOLT MCDOUGAL
Publisher:HOLT MCDOUGAL
Chapter11: Data Analysis And Probability
Section: Chapter Questions
Problem 8CR

Related questions
Question
Answer question b in the attatched photo.
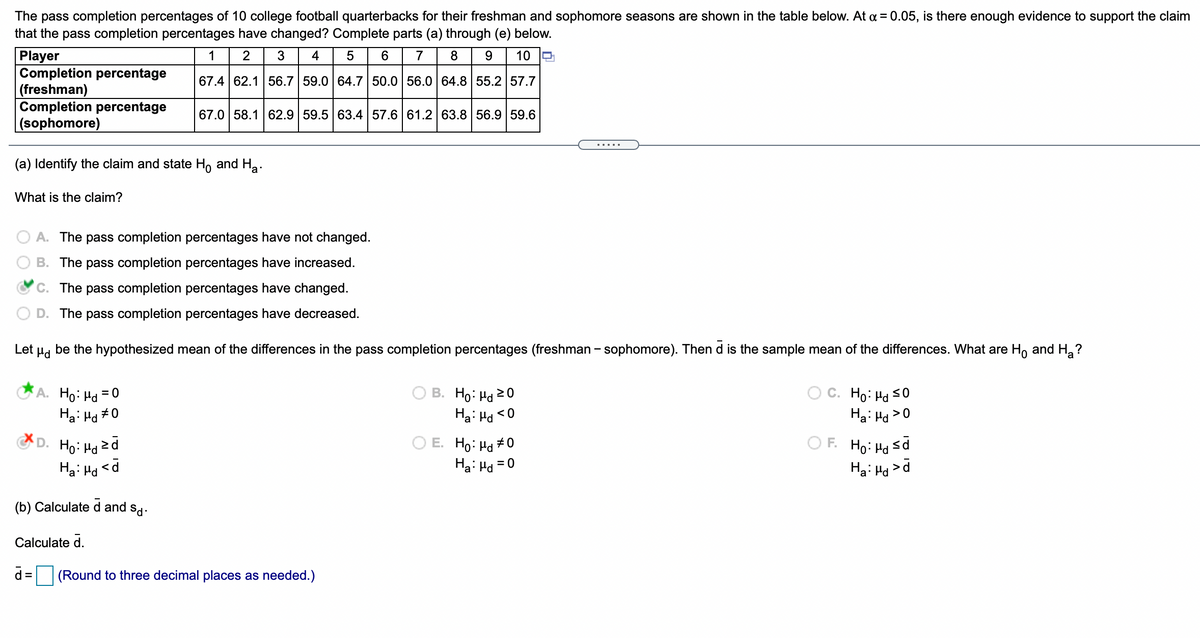
Transcribed Image Text:The pass completion percentages of 10 college football quarterbacks for their freshman and sophomore seasons are shown in the table below. At a = 0.05, is there enough evidence to support the claim
that the pass completion percentages have changed? Complete parts (a) through (e) below.
Player
Completion percentage
(freshman)
Completion percentage
(sophomore)
1
2
3
4
6
7
9.
10
67.4 62.1 56.7 59.0 64.7 50.0 56.0 64.8 55.2 57.7
67.0 58.1 62.9 59.5 63.4 57.6 61.2 63.8 56.9 59.6
.....
(a) Identify the claim and state H, and Ha.
What is the claim?
O A. The pass completion percentages have not changed.
B. The pass completion percentages have increased.
C. The pass completion percentages have changed.
D. The pass completion percentages have decreased.
Let Pd
be the hypothesized mean of the differences in the pass completion percentages (freshman - sophomore). Then d is the sample mean of the differences. What are Ho and H ?
A. Ho: Hd = 0
Ha: Ha #0
B. Ho: Hd 20
C. Ho: Ha s0
Ha: Hd >0
Ha: Ha <0
D. Ho: Ha 2d
O E. Ho: Hd #0
Ha: Hd = 0
O F. Ho: Hd sd
%3D
Ha: Hd
Ha: Hd
>
(b) Calculate d and sd.
Calculate d.
d =
(Round to three decimal places as needed.)
%3D
Expert Solution
This question has been solved!
Explore an expertly crafted, step-by-step solution for a thorough understanding of key concepts.

This is a popular solution!

Trending now
This is a popular solution!

Step by step
Solved in 2 steps with 2 images

Recommended textbooks for you
Holt Mcdougal Larson Pre-algebra: Student Edition…
Algebra
ISBN:
9780547587776
Author:
HOLT MCDOUGAL
Publisher:
HOLT MCDOUGAL
Holt Mcdougal Larson Pre-algebra: Student Edition…
Algebra
ISBN:
9780547587776
Author:
HOLT MCDOUGAL
Publisher:
HOLT MCDOUGAL