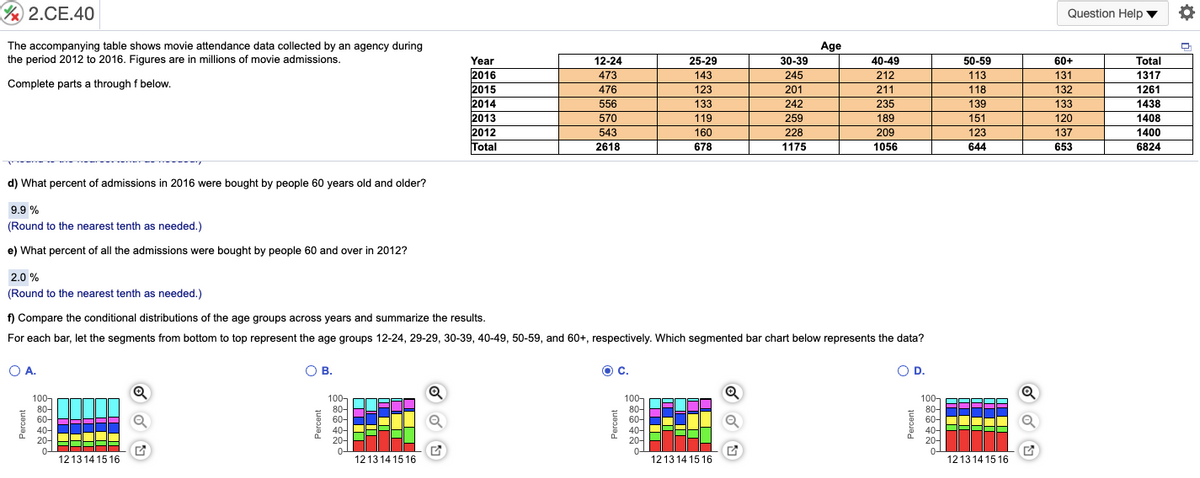
The accompanying table shows movie attendance data collected by an agency during the period 2012 to 2016. Figures are in millions of movie admissions. Age 30-39 Year 12-24 25-29 40-49 50-59 60+ Total 2016 2015 2014 2013 2012 Total 473 143 123 133 245 212 113 131 1317 Complete parts a through f below. 476 556 570 201 211 118 132 1261 242 235 139 133 1438 119 259 189 151 120 1408 1400 6824 543 160 228 209 123 137 2618 678 1175 1056 644 653 d) What percent of admissions in 2016 were bought by people 60 years old and older? 9.9 % (Round to the nearest tenth as needed.) e) What percent of all the admissions were bought by people 60 and over in 2012? 2.0 % (Round to the nearest tenth as needed.) ) Compare the conditional distributions of the age groups across years and summarize the results. For each bar, let the segments from bottom to top represent the age groups 12-24, 29-29, 30-39, 40-49, 50-59, and 60+, respectively. Which segmented bar chart below represents the data? OA. OB. OD. OD. C. Q 100- 100- 80- 60- 40- 20- 100- 80- 60- 40- 20- 100- 80- 60- Q O 40- 1213 14 15 16 121314 15 16 1213 14 15 16 121314 15 16
The accompanying table shows movie attendance data collected by an agency during the period 2012 to 2016. Figures are in millions of movie admissions. Age 30-39 Year 12-24 25-29 40-49 50-59 60+ Total 2016 2015 2014 2013 2012 Total 473 143 123 133 245 212 113 131 1317 Complete parts a through f below. 476 556 570 201 211 118 132 1261 242 235 139 133 1438 119 259 189 151 120 1408 1400 6824 543 160 228 209 123 137 2618 678 1175 1056 644 653 d) What percent of admissions in 2016 were bought by people 60 years old and older? 9.9 % (Round to the nearest tenth as needed.) e) What percent of all the admissions were bought by people 60 and over in 2012? 2.0 % (Round to the nearest tenth as needed.) ) Compare the conditional distributions of the age groups across years and summarize the results. For each bar, let the segments from bottom to top represent the age groups 12-24, 29-29, 30-39, 40-49, 50-59, and 60+, respectively. Which segmented bar chart below represents the data? OA. OB. OD. OD. C. Q 100- 100- 80- 60- 40- 20- 100- 80- 60- 40- 20- 100- 80- 60- Q O 40- 1213 14 15 16 121314 15 16 1213 14 15 16 121314 15 16

MATLAB: An Introduction with Applications
6th Edition
ISBN:9781119256830
Author:Amos Gilat
Publisher:Amos Gilat
Chapter1: Starting With Matlab
Section: Chapter Questions
Problem 1P

Related questions
Question
100%
please give me the answer of these questions.
Transcribed Image Text:Y 2.CE.40
Question Help v
The accompanying table shows movie attendance data collected by an agency during
the period 2012 to 2016. Figures are in millions of movie admissions.
Age
Year
12-24
473
476
556
25-29
30-39
40-49
50-59
60+
Total
2016
2015
2014
2013
2012
Total
143
123
133
119
131
132
133
120
245
212
113
1317
Complete parts a through f below.
201
211
118
1261
242
139
151
235
1438
259
570
543
2618
189
209
1408
160
123
644
228
137
1400
678
1175
1056
653
6824
d) What percent of admissions in 2016 were bought by people 60 years old and older?
9.9 %
(Round to the nearest tenth as needed.)
e) What percent of all the admissions were bought by people 60 and over in 2012?
2.0 %
(Round to the nearest tenth as needed.)
f) Compare the conditional distributions of the age groups across years and summarize the results.
For each bar, let the segments from bottom to top represent the age groups 12-24, 29-29, 30-39, 40-49, 50-59, and 60+, respectively. Which segmented bar chart below represents the data?
O A.
O B.
OC.
O D.
100,
80-
60-
40-
20-
100-
80-
60-
40-
20-
100-
80-
60-
40-
20-
100-
80-
60-
40-
20-
121314 15 16
1213 14 15 16
1213 14 15 16
1213 14 15 16
Percent
Percent
Percent
Percent
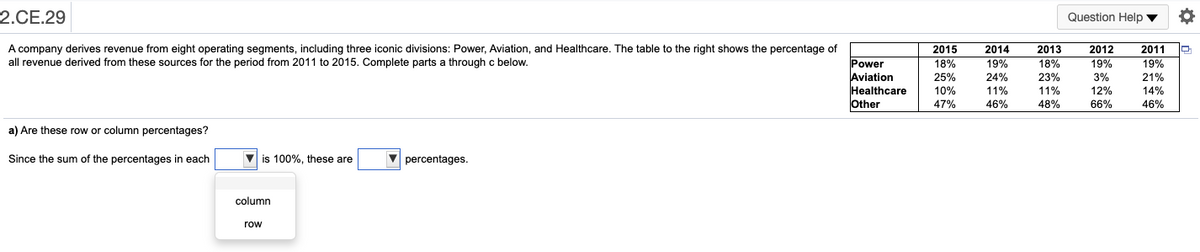
Transcribed Image Text:2.CE.29
Question Help ▼
A company derives revenue from eight operating segments, including three iconic divisions: Power, Aviation, and Healthcare. The table to the right shows the percentage of
2015
2014
2013
2012
2011
all revenue derived from these sources for the period from 2011 to 2015. Complete parts a through c below.
Power
Aviation
Healthcare
Other
18%
19%
18%
23%
11%
19%
19%
25%
24%
3%
21%
10%
11%
12%
14%
47%
46%
48%
66%
46%
a) Are these row or column percentages?
Since the sum of the percentages in each
is 100%, these are
V percentages.
column
row
Expert Solution
This question has been solved!
Explore an expertly crafted, step-by-step solution for a thorough understanding of key concepts.

This is a popular solution!

Trending now
This is a popular solution!

Step by step
Solved in 2 steps with 2 images

Knowledge Booster


Learn more about
Need a deep-dive on the concept behind this application? Look no further. Learn more about this topic, statistics and related others by exploring similar questions and additional content below.Recommended textbooks for you
MATLAB: An Introduction with Applications
Statistics
ISBN:
9781119256830
Author:
Amos Gilat
Publisher:
John Wiley & Sons Inc

Probability and Statistics for Engineering and th…
Statistics
ISBN:
9781305251809
Author:
Jay L. Devore
Publisher:
Cengage Learning

Statistics for The Behavioral Sciences (MindTap C…
Statistics
ISBN:
9781305504912
Author:
Frederick J Gravetter, Larry B. Wallnau
Publisher:
Cengage Learning
MATLAB: An Introduction with Applications
Statistics
ISBN:
9781119256830
Author:
Amos Gilat
Publisher:
John Wiley & Sons Inc
Probability and Statistics for Engineering and th…
Statistics
ISBN:
9781305251809
Author:
Jay L. Devore
Publisher:
Cengage Learning
Statistics for The Behavioral Sciences (MindTap C…
Statistics
ISBN:
9781305504912
Author:
Frederick J Gravetter, Larry B. Wallnau
Publisher:
Cengage Learning

Elementary Statistics: Picturing the World (7th E…
Statistics
ISBN:
9780134683416
Author:
Ron Larson, Betsy Farber
Publisher:
PEARSON

The Basic Practice of Statistics
Statistics
ISBN:
9781319042578
Author:
David S. Moore, William I. Notz, Michael A. Fligner
Publisher:
W. H. Freeman

Introduction to the Practice of Statistics
Statistics
ISBN:
9781319013387
Author:
David S. Moore, George P. McCabe, Bruce A. Craig
Publisher:
W. H. Freeman