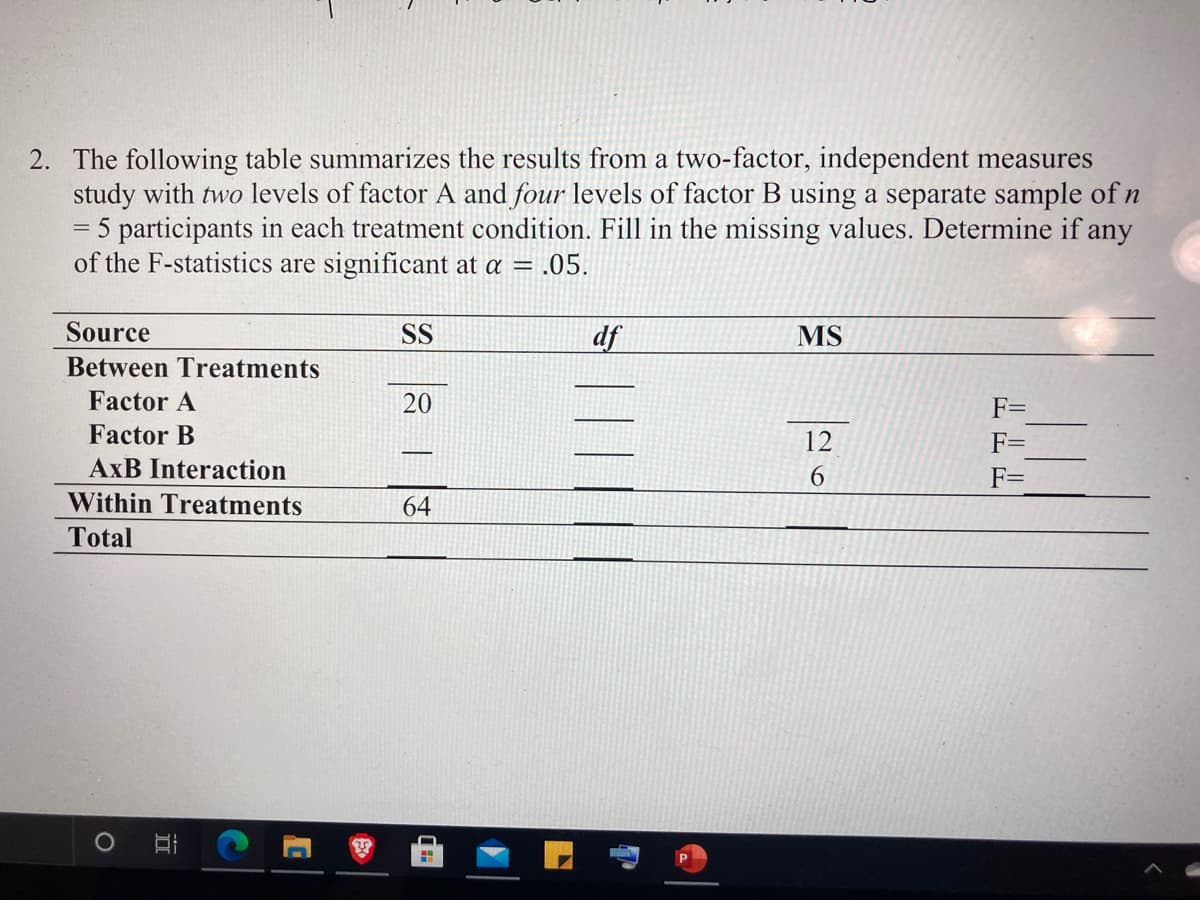
The following table summarizes the results from a two-factor, independent measures study with two levels of factor A and four levels of factor B using a separate sample of n = 5 participants in each treatment condition. Fill in the missing values. Determine if any of the F-statistics are significant at a = .05. Source SS df MS Between Treatments Factor A 20 F= Factor B 12 F= AxB Interaction F= Within Treatments 64 Total


Q: Determine the minimum data value, the quartiles, and the maximum data value for the PHT-34 and…
A: The quartiles Q1 Q2 and Q3 are medians of the data where Q2 is the median of the data and Q1 is the…
Q: The Cambridge Study in Delinquent Development was under- taken in north London to investigate the…
A: Solution: 1. Mode: The mode of a dataset is the number which occurs most frequently in the dataset.…
Q: The following table summarizes the results of a two-factor ANOVA evaluating an independent-measures…
A: Factor A has two levels , degrees of freedom = 2-1 = 1 Factor B has three levels , degrees of…
Q: The following data represent the results from an independent-measures study comparing two treatment…
A: Given data, Treatment 1 Treatment 2 4.5 3.9 2.4 3.6 5.4 2.8 4 3.7 4.7 4.4 3 3.7 3.2…
Q: An electrical engineer is interested in the effect on the tube conductivity of five different types…
A:
Q: The data below are from an independent-measures experiment comparing three different treatment…
A: Given Information: Treatment1 Treatment2 Treatment3 0 1 4 0 4 3 0 1 6 2 0 3
Q: The following table shows the results of a two-factor analysis of variance with two levels of factor…
A: Consider a two-factor analysis with two levels of factor A, three levels of factor B, and a…
Q: The following table shows the results of an analysis of variance comparing three treatment…
A: Since, there are three treatments then degree of freedom for sum of square of between will be: df of…
Q: he table below summarizes baseline characteristics of patients participating in a clinical trial. a)…
A: Given : We have given data represent baseline characteristics on patients participating in a…
Q: The following data are from an experiment comparing three treatment conditions. Use an ANOVA with…
A: Hypotheses information : The null and alternative hypotheses are as follows; Ho : µ1 = µ2 = µ3 Ha :…
Q: The following data were obtained from an independent-measures research study comparing three…
A:
Q: Using an alpha level of 0.05, are domestic calls more dangerous for officers than other types of…
A:
Q: In ongoing economic analyses, the U.S. federal government compares per capita incomes not only among…
A: Since you have posted a question with multiple sub-parts, we will solve first three sub-parts for…
Q: In ongoing economic analyses, the federal government compares per capita incomes not only among…
A:
Q: A Canadian study measuring depression level in teens (as reported in the Journal of Adolescence,…
A: Given information μ1 =mean depression score for male teen μ2 =mean depression score for female teen…
Q: tudy randomly assigned adult subjects to one of three exercise treatments: (1) a single long…
A: Given Significance level = 0.05
Q: The following table gives the number of parking tickets obtained in a semester and the GPAs of 77…
A: The given table contains the number of parking tickets obtained in a semester and the GPAs of 7…
Q: The following data summarize the results from an independent-measures study comparing three…
A: At α = .05, to check that: H0 : μtreatment 1 = μtreatment 2 = μtreatment 3 vs H1: H0 not true…
Q: The following summary table presents the results from an ANOVA comparing three treatment conditions…
A: ANOVA table with all the calculation is shown below
Q: The National Transportation Safety Board wants to look at the safety of three different sizes of…
A:
Q: In investigating whether stress is a factor in aging, telomere length was measured in women with…
A:
Q: A study assessed the lung destructive index among smokers and non-smokers provided the following…
A: Given , x¯1 = 14.5 , x¯2 =12.5 n1 = 10, n2 = 8 Pooled standard deviation = sp = 1.50 Claim : The…
Q: Fill in the blank: For these data, 1999 per capita incomes that are less than the mean of the…
A: We perform regression using the step by step procedure in excel: Enter the data into the Excel…
Q: A college professor is interested in finding out if there is a relationship between the post-test…
A: Given that Let X denotes the students score on Algebra and Y denotes on Calculus Significance…
Q: How does the cost of shipping a standard-sized crate relate to the distance of the destination? Can…
A:
Q: In ongoing economic analyses, the U.S. federal government compares per capita incomes not only among…
A: Note: Since we only answer up to 3 sub-parts, we'll answer the first 3. Please resubmit the…
Q: A study at the physics laboratory at İstanbul Kültür University is made to examine the defects in an…
A: Chi square test for independence: Chi square test is used to test whether the two categorical…
Q: A labour welfare officer returns the following number of workers observed with certain classes of…
A: Solution:
Q: The data set lowbwt contains information for a sample of 100 low birth weight infants born in two…
A: The output for the least square regression (using Excel) are SUMMARY OUTPUT Regression…
Q: The following data are from an independent-measures experiment comparing two treatment conditions:…
A: Null and alternative hypothesis is- H0:There is no difference between the treatments(μ1=μ2)H1: There…
Q: The quality control department of a fabric finishing plant is studying the effects of several…
A: Given :
Q: In ongoing economic analyses, the federal government compares per capita incomes not only among…
A: The sample data of 15 states is given here. The per capita income in $1000s is given for the two…
Q: The data below are stress-test scores from 6 nurses from the Emergency Care (EC) unit and 6 nurses…
A: Note: Since you have posted a question with multiple subparts, we will solve the first three…
Q: The following table shows the results of a two-factor analysis of variance with two levels of factor…
A: It is given that there are two levels of factor A, three levels of factor B, and sample of 5…
Q: The following observations were obtained when conducting a two-way ANOVA experiment with no…
A: SST = 275.667 SSA = 5.667 SSB = 253.167 SSE = 16.83
Q: The following table summarizes the results of a study on SAT prep courses, comparing SAT scores of…
A: " Since you have posted a question with multiple sub-parts, we will solve the first three subparts…
Q: Mr. Acosta, a sodiologist, is doing a study to see if there is a relationship between the age of a…
A: Dear student as per guidelines we answer the first three subparts only. Solution. Use chi square…
Q: An experiment was conducted to investigate the effects of the concentrations of sulfuric acid…
A:
Q: Given that the interaction is significant, you can reanalyze the data with the two factors collapsed…
A:
Q: The director of marketing at Vanguard Corporation believes that sales of the company's Bright Side…
A: There are many statistical tools which used to analysis the data set. Out of that there are some…
Q: The data below are from an independent-measures experiment comparing three different treatment…
A: Given table :
Q: The following table shows the results of a two-factor analysis of variance with 2 levels of factor…
A: Total number of observations = 3×2×5 = 30.Total degrees of freedom = 30-1 = 29.There are two levels…
Q: The following data represent the results of an independent-measures study comparing two treatment…
A:
Q: The following data summarize the results from an independent-measures study comparing three…
A: Null hypothesis: There is no significant differences among the three treatment means. Alternative…
Q: The following table summarizes the results from a two-factor study with two levels of factor A and…
A: The calculation is shown below
Q: A researcher has used a one-way analysis of variance model to test whether the average starting…
A: Source SS DF MS F Treatment 72 3 24 6 Error 48 12 4 Total 120 15
Q: The following table shows the results of an analysis of variance comparing four treatment conditions…
A: From the given table, SSbetween=30 SSTotal=62 SSwithin=SSTotal-SSbetween=62-30=32
Q: The following data represent the results from an independent-measures experiment comparing three…
A: Hello! As you have posted 2 different questions, we are answering the first question. In case you…
Q: The following table shows the results of a two-factor analysis of variance with 2 levels of factor…
A: The sum of squares between is 80, the sum of squares due to factor A is 8, and the mean square due…
Q: State the null hypothesis. 2) Calculate necessary statistics (USE AN ANOVA even though K=2, and a =…
A:


Trending now
This is a popular solution!

Step by step
Solved in 2 steps


- What is meant by the sample space of an experiment?The following table summarizes the results from a two-factor study with two levels of factor A and four levels of factor B using a separate sample of n=5 participants in each treatment condition. Fill in the missing values. Determine if any of the F-statistics are significant at . Source SS df MS Between Treatments ____ ____ Factor A 20 ____ ____ F=____ Factor B __ ____ 12 F=____ AxB Interaction ____ ____ 6 F=____ Within Treatments 64 ____ ____ Total ____ ____A sociologist wants to investigate the question, "Is there a relationship between texting during class and grade-point-average (GPA) among high school seniors in a large district?" Which study design is most appropriate? Before the semester starts, randomly select 40 seniors from each high school who do not text during class. Assign 20 to the texting treatment group (text three or more times during every class meeting) and 20 to the control group (no texting during class). At the end of the semester, obtain each student’s GPA from the appropriate admissions and records office. Compare the GPA of students who routinely text during class to the GPA of students who do not text during class. Before the semester starts, randomly select 40 seniors from each high school who do not text during class. Assign 20 to the texting treatment group (text three or more times during every class meeting) and 20 to the control group (no texting during class). At the end of the semester,…
- 3. Research suggests that depression significantly increases the risk of developing dementia later in life. Suppose that in a study involving 949 elderly persons, it was found that 22% of those who had depression went on to develop dementia, compared to only 17% of those who did not have depression. a) Describe the relevant population and the sample.b) Are the numbers 22% and 17% associated with the population or a sample?Do well-rounded people get fewer colds? A study on the Chronicle of Higher Education was conducted by scientist at Carnegie Mellon University, the University of Pittsburgh and the University of Virginia. They found that people who have only a few social outlets get more colds than those who are involved in a variety of social activities. Suppose that of the 276 healthy men and women tested, n1=96 had only a few social outlets and n2=105 were busy with six or more activities. When these people were exposed to a cold virus, the following results were observed: Construct a 99% confidence interval for the difference in the two population proportions.A sample of 15 maple trees in Vermont were treated with one of three amounts of fertilizer, Low (group 1), Medium (group 2) and High (group 3). The volume in sap (measured in mL) produced by each tree was recorded, and a Single-Factor ANOVA test was performed, which ended up rejecting . The Summary table and the ANOVA table produced by Excel are given below: SUMMARY Groups Count Sum Average Variance Low 5 398.1 79.62 27.572 Medium 5 477.2 95.44 3.703 High 5 445.1 89.02 11.357 ANOVA Source of Variation SS df MS F Between Groups 633.0813333 2 316.5406667 22.27486395 Within Groups 170.528 12 14.21066667 Total 803.6093333 14 If you follow up the ANOVA test with a FORMAL Fisher's LSD Pairwise Comparison (PWC) test on , then use the information provided in the Excel-generated output to calculate the value of the Test Statistic (TS) that you would use to perform this PWC test. Round off your final answer to the…
- Suppose a study was conducted to compare the sleep deprivation rates of Californians and Oregonians. The proportion of California residents who reported insufficient rest or sleep during each of the preceding 30 days is 8.8%, while this proportion is 7% for Oregon residents. These data are based on simple random samples of 1,545 California and 1,460 Oregon adult residents. a) Conduct a hypothesis test to determine if these data provide strong evidence the rate of sleep deprivation is different for the two states. Use California as Group A and Oregon as Group B.Test statistic (Round to 4 decimal places): p-value (round to 4 decimal places): Conclusion at the 5% level of significance: We accept the null hypothesis. We reject the null hypothesis. We fail to reject the null hypothesis. b) It is possible the conclusion of the test in part (a) is incorrect (contradicts with the reality). If this is the case, what type of error was made? Type I Error Type III Error Type II Error A…5.The following table summarized the age and blood pressure status of 474 randomly selected Canadian adults in 2017. At the 10% significance level, do the data provide sufficient evidence to conclude that age and blood pressure are associated?Suppose that 80% of 3–4-year-old children and 70% of5–8-year-old children in a village are vaccinated with QIVvaccine. Also assume that children who are not vaccinatedhave twice the incidence of influenza as the control groupin Table 3.7.3.29 What % of 3–4-year-old children in the village will getinfluenza?3.30 What % of 5–8-year-old children in the village will getinfluenza?3.31 Suppose we identify a 5–8-year-old child with influenzain the village but are uncertain whether the childwas vaccinated. If we make the same assumptions as inProblems 3.29–3.30, then what is the probability that thechild was vaccinated? (Hint: Use Bayes’ rule here.)
- The manager of a company that assembles and exports a particular type of pumps wants to know if there is a link between the number of hours spent by assembly workers in training and their productivity on the job. A random sample of 7 assembly workers was selected and their performances evaluated. The summary of the obtained data is listed in Table 2. Table 2: Shows the time spend by workers during training and their productivity on jobTraining hours (x) 20 36 20 38 40 33 32Output (y) 40 70 44 56 60 48 62 (i) Construct a scatter plot of the sample data and comment on the relationship between hours of training and output. (ii) Estimate a simple regression line, using the method of least squares, to identify a linear relationship between the hours of training received by assembly workers and their output (i.e. number of units assembled per day). (iii) Interpret, in context, the gradient/slope of the regression line. (iv) Estimated the output at 20 hours training time. (v) Interpret the…A low-level CDC bureaucrat wants to please his boss by gathering evidence thatthe current government-mandated shutdown of society is not causing people’s mentalhealth to deteriorate, so that it can safely be continued for several years if anyexpert says it’s necessary.He polls a random sample of 1600 citizens, gathering data on such items asincome loss, weight gain, access to toilet paper, hours spent binge-watchingNetflix, and number of injuries caused by household fights, and compiles all thisinto a scientifically-weighted “misery index”.The mean misery index from the sample is 99.2; it seems reasonable to use apopulation standard deviation σ = 19.1.a) Does this information provide significant evidence (at the 5% level) that thenationwide mean misery index is less than 100? Set up appropriate null andalternative hypotheses, calculate the appropriate test statistic, find the P-value,and state your conclusion. (10)b) A CDC press release publishing the results of this study claims that…A low-level CDC bureaucrat wants to please his boss by gathering evidence thatthe current government-mandated shutdown of society is not causing people’s mentalhealth to deteriorate, so that it can safely be continued for several years if anyexpert says it’s necessary.He polls a random sample of 1600 citizens, gathering data on such items asincome loss, weight gain, access to toilet paper, hours spent binge-watchingNetflix, and number of injuries caused by household fights, and compiles all thisinto a scientifically-weighted “misery index”.The mean misery index from the sample is 99.2; it seems reasonable to use apopulation standard deviation σ = 19.1.a) Does this information provide significant evidence (at the 5% level) that thenationwide mean misery index is less than 100? Set up appropriate null andalternative hypotheses, calculate the appropriate test statistic, find the P-value,and state your conclusion. b) A CDC press release publishing the results of this study claims that…
