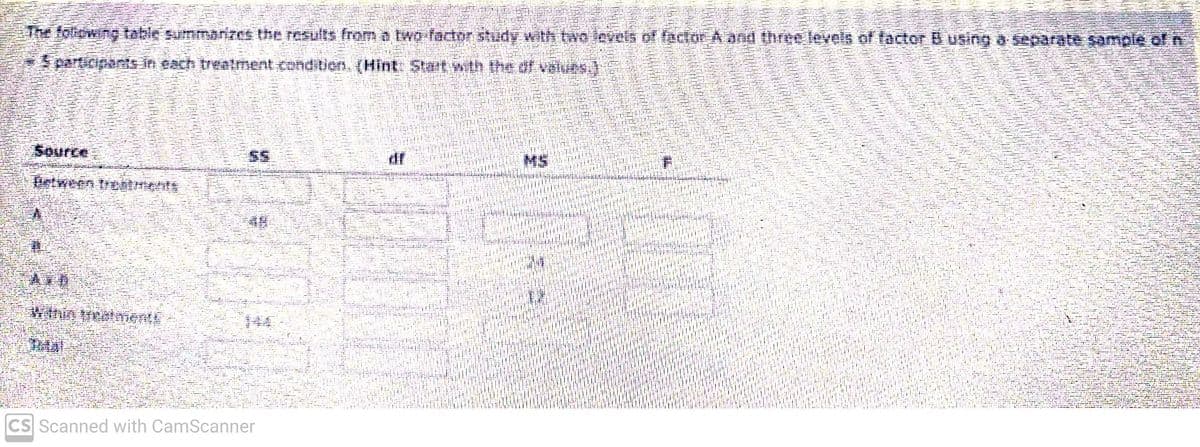
The following table summarizes the results from a two-factor study with two levels of factor A and three levels of factor B using a separate sample of n 3 participants in each treatment condition. (Hint: Start with the of values.) Source Between treatments AND Within treatments $$ 48 144 df MS


Q: The hourly wages of a sample of 130 general workers are given below: mean = 60 range = 20 The…
A: Coefficient of variation calculated in Percentage.
Q: Customers arrive at a railway ticket counter at the rate of 30 per hour. Assuming Poisson arrivals,…
A:
Q: At the bakery you chose one dozen cookies. You purchased 3 sugar cookies, 4 chocolate chip cookies,…
A: 3 sugar cookies4 chocolate cookies5 peanut butters cookies_______________12 total cookiesselect 2 at…
Q: When investigating a question involving a scale dependent variable (IV) with three or more variables…
A: Here option A is correct.(false) Explanation: The one-way analysis of variance (ANOVA) is used to…
Q: To test Ho: o=1.7 versus H₁: o>1.7, a random sample of size n = 22 is obtained from a population…
A: H0 : σ = 1.7H1 : σ > 1.7n =22
Q: A doctor released the results of clinical trials for a vaccine to prevent a particular disease. In…
A: We have given that n1 = 100000 , x1 = 15 n2 = 100000 , x2 = 50
Q: Suppose that you are in charge to see if dropping a computer will damage it. You want to find the…
A:
Q: If a customer has to wait in an (M/M/1): (/FIFO) queue ystem, what is his average waiting time in…
A: It is given that λ = 8 per hour μ = 12 per hour
Q: Yk μ = 8 di = = Bi - = (αβ) Specify the appropriate linear model and define each component in the…
A: Designs are usually distinguished by the way experimental units are grouped and by the way…
Q: A college claims that the proportion, p, of students who commute more than fifteen miles to school…
A: given data, claim:p<0.25n=260x=46p^=xn=46260=0.1769α=0.05
Q: Name Age Salary Donor? Nancy 21 37,000 N Jim 27 41,000 Allen 43 61,000 Jane 38 55,000 Steve 44…
A:
Q: A standardized exam's scores are normally distributed. In a recent year, the mean test score was…
A: GivenMean(μ)=1451standard deviation(σ)=316
Q: What is the difference between statistical significance and critical value?
A: A critical value is the value of the test statistic which the test statistic is defined by the upper…
Q: reliable. I. Heavier cars tend to be less II. Heavier cars tend to cost more to maintain. III. Car…
A: From given data we have : Corr (weight , reliability)=-0.30 Corr (weight , annual maintenance)=0.20
Q: Assume there are 3,600 cases in the validation dataset, and 12% of these cases have a value of 1 for…
A:
Q: State the equations of the two regression lines. what is the angle between them?
A:
Q: Below is a graph that depicts new born baby weights from data taken from the CDC. low birth weight:…
A: As per our guidelines I can solve only first three subparts. Kindly post the remaining subparts…
Q: c) Compute the z value that corresponds to X= 12.9 fluid ounces. Round to 2 decimal places. Show…
A: given data normal distribution μ = 12.6σ = 0.15
Q: For the standard normal distribution shown on the right, find the probability of z occurring in the…
A: Required probability is P(Z>-1.95)
Q: A coin-operated drink machine was designed to discharge a mean of 9 fluid ounces of coffee per cup.…
A:
Q: Customers arrive at a one-man barbershop according to a Poisson process with a mean inter-arrival…
A:
Q: Consider a panel data set and the following regression model. Yit Bo + B₁Xit + ++ Uit What do…
A: Option B is the answer Generally, bo is y intercept(constant term) b1 is slope
Q: Determine the upper-tail critical value to/2 in each of the following circumstances. a. 1-α=0.90, n…
A: upper - tail test we have to find out the critical value for the given data
Q: top stu ents, an administrator at a college claims that this year's entering class must have a…
A: given data, claim:μ>113n=18x¯=116s=9α=0.05
Q: Public Housing Authority in a certain community conducted a survey of 1000 families to determine the…
A: Suppose a random experiment E is repeated n times under same essential conditions and an even A,…
Q: Consider an M/M/1 queueing system. If λ = 6 per hour and μ = 8 per hour find the probability of at…
A: For the given queueing system, the value of λ is 6 and the value of μ is 8 respectively. The number…
Q: Test the claim that the proportion of men who own cats is significantly different than the…
A: From the provided information, nM=40p^M=0.45nF=60p^F=0.55 Level of significance (α) = 0.02
Q: Does spending time online lead to greater unhappiness? To investigate this question, a researcher…
A: Option C is th answer. Answer : one -way between - groups ANOVA
Q: Define OLS and what it is. Why do we use OLS for linear regressions? What are limitations of using…
A: Ordinary Least Squares: The ordinary least squares (OLS) method can be defined as a linear…
Q: Regression Model – In a simple linear regression, the standard model takes the form of Y ≈ β0 + β1X…
A:
Q: Regression Transformation – A core assumption of linear regression is that the dependent variable…
A: Solution: Regression is a technique that is used to estimate the dependent variable by using the one…
Q: Do the odds of churning increase or decrease when the customer has a two-year contract as compared…
A: Given Information: Consider the results of the coefficients and statistics table from a Logistic…
Q: According to a recent survey, 52% of UAE residents are considering a switch to hybrid or electric…
A: Given: P = 0.52 n = 250 X = 145 α = 1% = 0.01 Formula Used: Test-statistic Z = p-PP(1-P)n
Q: Under the new process, the CTO has specified that 0.50 ± 0.01 mL of rennet should be added for every…
A: Note: In case of multiple questions, as per the guidelines, answer to first question will be…
Q: Drug Effects: A new muscle relaxant is available. Researchers from the firm developing the relaxant…
A: Given: μ = 38 σ = 5 n = 10 X = 35 Formula Used: Z = X-μσn
Q: cording to a recent survey, the probability that the driver in a fatal vehicle accident is female…
A: GIVEN DATA event A : river 24 years old or lessevent F : driver in a fatal accident is femaleP(F) =…
Q: - Assume a population of 40, 45, 47, and 53. Assume that samples of size n = 2 are randomly selected…
A: Introduction: It is required to obtain the sampling distribution of the sample medians.
Q: In a sample of 58 men, 44 said that they had less leisure time today than they had 10 years ago. In…
A: Given data: Significance level= 0.10
Q: What statistical test should a researcher use if the researcher is examining the relation between…
A: To check which test is appropriate for examining the relationship between two scale variables.
Q: For X₁=23, n₁ =52, X₂=38, and n₂=71, find p and q. Round your answers to 3 decimal places as needed.…
A: Given :
Q: Shamma conducted a left-tail test to determine whether ZU students sleep, on average, less than 7…
A: We have given that the p-value for the left tailed test is p-value = 0.125
Q: Using the Little's formula, obtain the average waiting time in the system for M/M/1/N model.
A:
Q: Concurrent Validity. When the instrument can predict results similar to those similar tests already…
A: Given: Concurrent Validity Definition and Examples
Q: Interpret the estimated R2 Does the residual plot suggest that the fitted regression line is…
A:
Q: Although arsenic is known to be a poison, it also has some beneficial medicinal uses. In one study…
A: Given Information: Sample size n=100 32% were in remission and showed no signs of leukemia in…
Q: A simple random sample of size n is drawn. The sample mean, x, is found to be 18.6, and the sample…
A: GivenMean(x)=18.6standard deviation(s)=4.3
Q: Regression Model – In a simple linear regression, the standard model takes the form of Y ≈ β0 + β1X…
A: In a simple regression model of the form Y = bo +b1X
Q: What shape would be predicted for a frequency distribution with a mean of 39.9, median of 40.1 and…
A: The following information has been provided: Mean =39.9 Median= 40.1 Mode=40
Q: The manufacturer claims that your new car gets 35 mpg on the highway. You suspect that the mpg is a…
A: Solution-: Given: x¯=40.4,μ0=35,n=66,s=13.7,α=0.01 We want to find p-value=?
Q: You want to obtain a sample to estimate a population proportion. Based on previous evidence, you…
A: Givenpopulation proportion (p)=0.32Margin of error(E)=5%=0.05confidence level=97%

Step by step
Solved in 4 steps

- Researchers report that university students who are on Twitter or have it running in the background) while studying had lower grades than students who did not use the social network. A researcher would like to know if the same result extends to students in lower grade levels. The researcher planned a two-factor study comparing Twitter users with nonusers for primary school students, high school students, and university students. Forconsistency across groups, grades were converted into six categories, numbered 0–5 from low to high. What are the dependent and independent variables in this study?Suppose that 73.2% of all adults with type 2 diabetes also suffer from hypertension. After developing a new drug to treat type 2 diabetes, a team of researchers at a pharmaceutical company wanted to know if their drug had any impact on the incidence of hypertension for diabetics who took their drug. The researchers selected a random sample of 1000 participants who had been taking their drug as part of a recent large-scale clinical trial and found that 718 suffered from hypertension. The researchers want to use a one‑sample ?z‑test for a population proportion to see if the proportion of type 2 diabetics who have hypertension while taking their new drug, ?p, is different from the proportion of all type 2 diabetics who have hypertension. They decide to use a significance level of ?=0.01α=0.01. Determine the value of the ?z‑test statistic. Give your answer precise to two decimal places. Determine the ?-valueP-value for this test. Give your answer precise to three decimal places.A study is being carried out in the operating room of the Regional Hospital of Veraguas to establish whether the type of surgery influences the appearance of nosocomial infections in obese patients who underwent a tubular gastrectomy. The 80 patients in the study are divided into two groups, one of whom had had an open surgery (44 patients) and the others a clean surgery. There were 37 patients with infection from open surgery and 14 with infection from clean surgery. If you did not have a nosocomial infection, what is the probability that you had clean surgery? What is the probability that a patient will have clean surgery? What is the probability that a patient will have open surgery? What is the probability of clean surgery or nosocomial infection? What is the probability of no nosocomial infection or clean surgery? If you had clean surgery, what is the probability of a nosocomial infection? If you had clean surgery, what is the probability of no nosocomial infection? If you had…
- And conduct a two-factor ANOVA to investigate the effects of gender (The name of the variable in SPSS is "gender" and it has two levels, "male" vs. "female") and "minority classification" (In SPSS, the name of the variable is "minority", its label is "Minority Classification" ,and it has two levels "yes" and "no"; referring to whether an individual is part of a minority or not ) on beginning salary (In SPSS the name of the variable is "salbegin", and its label is "Beginning Salary). Use α = .05 a. If the main effect of Minority Classification is significant, describe the main effect of Minority Classification. Include the overall means and corresponding standard deviations in your description. Example = If there is a main effect of maternal diet, is the main effect of maternal diet significant? Why? Provide F-statistic, df of numerator, df of denominator, and p- value? Yes, the main effect of maternal diet is significant because p is less than alpha, F(1,16) = 40.67, p = .0001And conduct a two-factor ANOVA to investigate the effects of gender (The name of the variable in SPSS is "gender" and it has two levels, "male" vs. "female") and "minority classification" (In SPSS, the name of the variable is "minority", its label is "Minority Classification" ,and it has two levels "yes" and "no"; referring to whether an individual is part of a minority or not ) on beginning salary (In SPSS the name of the variable is "salbegin", and its label is "Beginning Salary). Use α = .05 a. What are the independent variables and what are the two levels or conditions of each independent variable? b. State the three alternative hypotheses in words. State the alternative hypothesis of the interaction in terms of whether the effects of he effect of Minority Classification on Beginning Salary depend on the levels of Gender (i.e., on whether you are a male or a female)And conduct a two-factor ANOVA to investigate the effects of gender (The name of the variable in SPSS is "gender" and it has two levels, "male" vs. "female") and "minority classification" (In SPSS, the name of the variable is "minority", its label is "Minority Classification" ,and it has two levels "yes" and "no"; referring to whether an individual is part of a minority or not ) on beginning salary (In SPSS the name of the variable is "salbegin", and its label is "Beginning Salary). Use α = .05 a.If there is a main effect of gender, is the main effect of gender significant? Why? Provide F-statistic, df of numerator, df of denominator, and p- value?
- And conduct a two-factor ANOVA to investigate the effects of gender (The name of the variable in SPSS is "gender" and it has two levels, "male" vs. "female") and "minority classification" (In SPSS, the name of the variable is "minority", its label is "Minority Classification" ,and it has two levels "yes" and "no"; referring to whether an individual is part of a minority or not ) on beginning salary (In SPSS the name of the variable is "salbegin", and its label is "Beginning Salary). Use α = .05 a. If the Gender by Minority Classification interaction is significant, describe the interaction. Include individual means and their corresponding standard deviations in your description.And conduct a two-factor ANOVA to investigate the effects of gender (The name of the variable in SPSS is "gender" and it has two levels, "male" vs. "female") and "minority classification" (In SPSS, the name of the variable is "minority", its label is "Minority Classification" ,and it has two levels "yes" and "no"; referring to whether an individual is part of a minority or not ) on beginning salary (In SPSS the name of the variable is "salbegin", and its label is "Beginning Salary). Use α = .05 a. If the main effect of Minority Classification is significant, describe the main effect of Minority Classification. Include the overall means and corresponding standard deviations in your description.And conduct a two-factor ANOVA to investigate the effects of gender (The name of the variable in SPSS is "gender" and it has two levels, "male" vs. "female") and "minority classification" (In SPSS, the name of the variable is "minority", its label is "Minority Classification" ,and it has two levels "yes" and "no"; referring to whether an individual is part of a minority or not ) on beginning salary (In SPSS the name of the variable is "salbegin", and its label is "Beginning Salary). Use α = .05 a. If there is an interaction, is the interaction significant? That is, does the effect of Minority Classification on Beginning Salary depend on the levels of Gender(i.e., on whether you are a male or a female)? Why? Provide F-statistic, df of the numerator, df of the denominator , and p-value.
- As horses get older, poor hoof and tendon health leads to joint pain, reducing a horse’s activity level. Such a reduction can lead to other health concerns such as obesity and a decrease in energy due to lack of exercise. A study is to be conducted to determine which of two diet supplements, Vitamin C and D-cycloserine, is more effective in promoting hoof and tendon health and reducing the onset of osteoporosis in horses. Researchers will randomly select a total of 300 horses from ten different large animal veterinary practices around the country. All of the horses are more than 5 years old, and their owners have given consent to participate in the study. Changes in hoof and tendon health will be evaluated after 6 months of treatment. What would be an advantage to adding a control group in the design of this study? Assuming a control group is added to the other two groups in the study, explain how you would assign the 300 horses to these three groups for a completely randomized…The following table summarizes the results from a two-factor study with two levels of factor A and three levels of factor B using a separate sample of n=5 participants in each treatment condition. Fill in the missing values.What is a 2 × 5 factorial experimental design?


