And conduct a two-factor ANOVA to investigate the effects of gender (The name of the variable in SPSS is "gender" and it has two levels, "male" vs. "female") and "minority classification" (In SPSS, the name of the variable is "minority",  its label is "Minority Classification" ,and it has two levels "yes" and "no"; referring to whether an individual is part of a minority or not ) on beginning salary (In SPSS the name of the variable is "salbegin", and its label is "Beginning Salary). Use α = .05 a. If the main effect of Minority Classification is significant, describe the main effect of  Minority Classification. Include the overall means and corresponding standard deviations in your description.

College Algebra (MindTap Course List)
12th Edition
ISBN:9781305652231
Author:R. David Gustafson, Jeff Hughes
Publisher:R. David Gustafson, Jeff Hughes
Chapter8: Sequences, Series, And Probability
Section8.7: Probability
Problem 58E: What is meant by the sample space of an experiment?
icon
Related questions
Question

And conduct a two-factor ANOVA to investigate the effects of gender (The name of the variable in SPSS is "gender" and it has two levels, "male" vs. "female") and "minority classification" (In SPSS, the name of the variable is "minority",  its label is "Minority Classification" ,and it has two levels "yes" and "no"; referring to whether an individual is part of a minority or not ) on beginning salary (In SPSS the name of the variable is "salbegin", and its label is "Beginning Salary). Use α = .05

a. If the main effect of Minority Classification is significant, describe the main effect of  Minority Classification. Include the overall means and corresponding standard deviations in your description.


Example =

  1. If there is a main effect of maternal diet, is the main effect of maternal diet significant? Why? Provide F-statistic, df of numerator, df of denominator, and p- value?

Yes, the main effect of maternal diet is significant because p is less than alpha, F(1,16) = 40.67, p = .0001

Jnivariate Analysis of Variance
Gender
Minority Classification
Mean
画Title
Std. Deviation
Female
No
Notes
LActive Dataset
Between-Subjects Factors
Tests of Between-Subjects Effer
513,351.22
$3,064.901
176
Yes
$11,951.25
$1,928.547
40
Total
513,091.97
$2,935.599
216
Male
No
$21,593.81
$9,677.754
-og
Univariate Analysis of Variance
194
Yes
$16,383.75
55,570.359
64
會Title
Total
$20,301.40
$9,111.781
258
Notes
Total
No
$17,673.01
58,392.419
370
Warnings
Between-Subjects Factors
L Tests of Between-Subjects Effer
Yes
$14,678.94
$5,008.239
104
Total
$17,016.09
$7,870.638
474
Log
Univariate Analysis of Variance
Title
Tests of Between-Subjects Effects
Notes
Dependent Variable: Beginning Salary
KO Warnings
Between-Subjects Factors
Descriptive Statistics
Tests of Between-Subjects Effer
Type II Sum
of Squares
df
Mean Square
Sig.
Source
Corrected Model
7480975488
3
2493658496
53.713
.000
Intercept
7.781E+10
1
7.781E+10
1676.084
.000
3121908838
1
3121908838
67.246
.000
gender
849034957.1
18.288
.000
minority
849034957.1
282090873.7
6.076
.014
282090873.7
gender* minority
470
46425381.87
2.182E+10
Error
474
1.665E+11
Total
473
2.930E+10
Corrected Total
a. R Squared = .255 (Adjusted R Squared .251)
Double click to edit Log
C
Transcribed Image Text:Jnivariate Analysis of Variance Gender Minority Classification Mean 画Title Std. Deviation Female No Notes LActive Dataset Between-Subjects Factors Tests of Between-Subjects Effer 513,351.22 $3,064.901 176 Yes $11,951.25 $1,928.547 40 Total 513,091.97 $2,935.599 216 Male No $21,593.81 $9,677.754 -og Univariate Analysis of Variance 194 Yes $16,383.75 55,570.359 64 會Title Total $20,301.40 $9,111.781 258 Notes Total No $17,673.01 58,392.419 370 Warnings Between-Subjects Factors L Tests of Between-Subjects Effer Yes $14,678.94 $5,008.239 104 Total $17,016.09 $7,870.638 474 Log Univariate Analysis of Variance Title Tests of Between-Subjects Effects Notes Dependent Variable: Beginning Salary KO Warnings Between-Subjects Factors Descriptive Statistics Tests of Between-Subjects Effer Type II Sum of Squares df Mean Square Sig. Source Corrected Model 7480975488 3 2493658496 53.713 .000 Intercept 7.781E+10 1 7.781E+10 1676.084 .000 3121908838 1 3121908838 67.246 .000 gender 849034957.1 18.288 .000 minority 849034957.1 282090873.7 6.076 .014 282090873.7 gender* minority 470 46425381.87 2.182E+10 Error 474 1.665E+11 Total 473 2.930E+10 Corrected Total a. R Squared = .255 (Adjusted R Squared .251) Double click to edit Log C
Utilities
Extensions
Window
Output
[自Log
EUnivariate Analysis of
because there are fewer than three groups.
會Title
Notes
Between-Subjects Factors
Active Dataset
Value Label
Between-Subjects
Gender
Tests of Between-
f
Female
216
Log
Male
258
EUnivariate Analysis of V
Minority Classification
0.
No
370
會Title
1
Yes
104
Notes
Warnings
Between-Subjects
Tests of Between-
Descriptive Statistics
Log
Dependent Variable: Beginning Salary
EUnivariate Analysis of
Gender
Minority Classification
Mean
Std. Deviation
N
Title
Female
No
$13,351.22
$3,064.901
176
Notes
Yes
$11,951.25
$1,928.547
40
Warnings
Total
$13,091.97
$2,935.599
216
Between-Subjects
$21,593.81
$9,677.754
194
Descriptive Statist
Male
No
Tests of Between-
$16,383.75
$5,570.359
64
Yes
$20,301.40
$9,111.781
258
Total
$17,673.01
$8,392.419
370
Total
No
104
$14,678.94
$5,008.239
Yes
474
$17,016.09
$7,870.638
Total
Transcribed Image Text:Utilities Extensions Window Output [自Log EUnivariate Analysis of because there are fewer than three groups. 會Title Notes Between-Subjects Factors Active Dataset Value Label Between-Subjects Gender Tests of Between- f Female 216 Log Male 258 EUnivariate Analysis of V Minority Classification 0. No 370 會Title 1 Yes 104 Notes Warnings Between-Subjects Tests of Between- Descriptive Statistics Log Dependent Variable: Beginning Salary EUnivariate Analysis of Gender Minority Classification Mean Std. Deviation N Title Female No $13,351.22 $3,064.901 176 Notes Yes $11,951.25 $1,928.547 40 Warnings Total $13,091.97 $2,935.599 216 Between-Subjects $21,593.81 $9,677.754 194 Descriptive Statist Male No Tests of Between- $16,383.75 $5,570.359 64 Yes $20,301.40 $9,111.781 258 Total $17,673.01 $8,392.419 370 Total No 104 $14,678.94 $5,008.239 Yes 474 $17,016.09 $7,870.638 Total
Expert Solution
Step 1

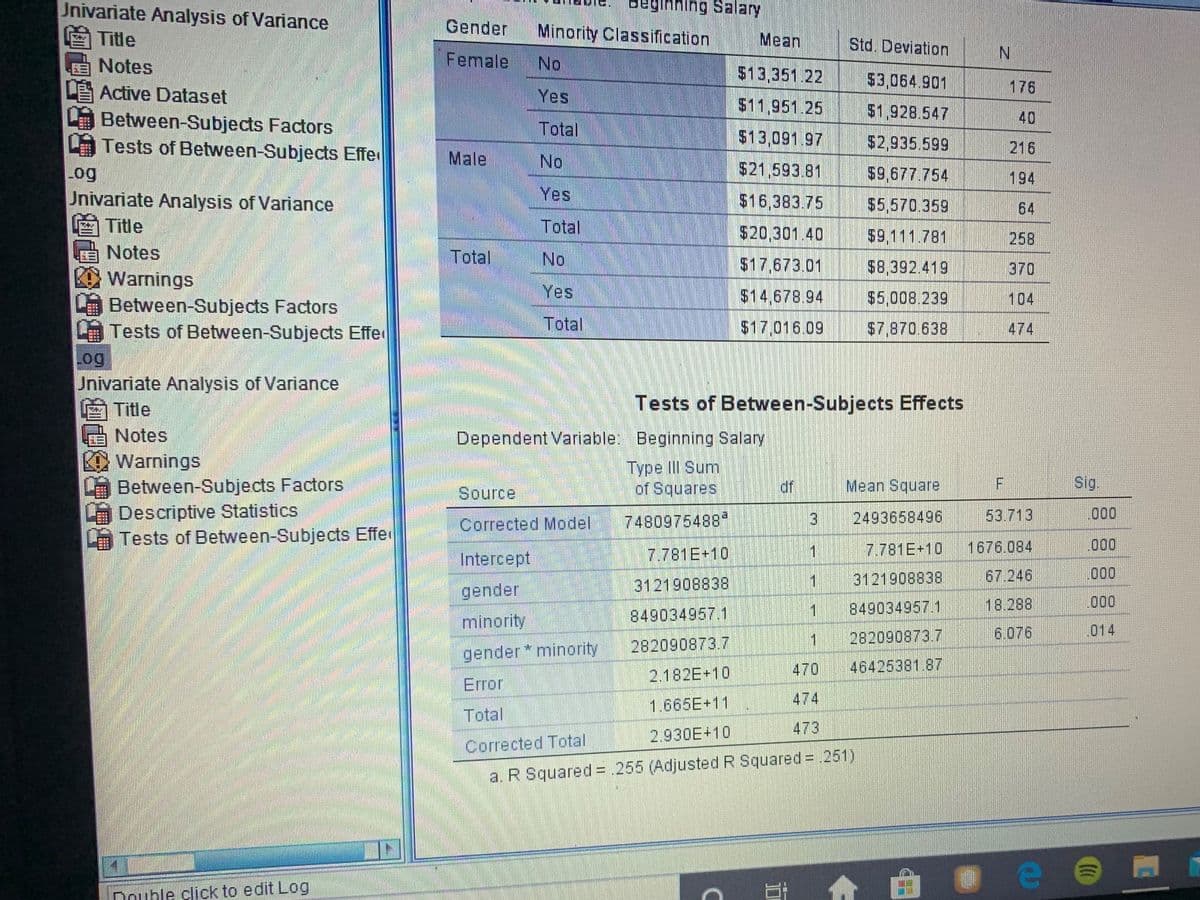
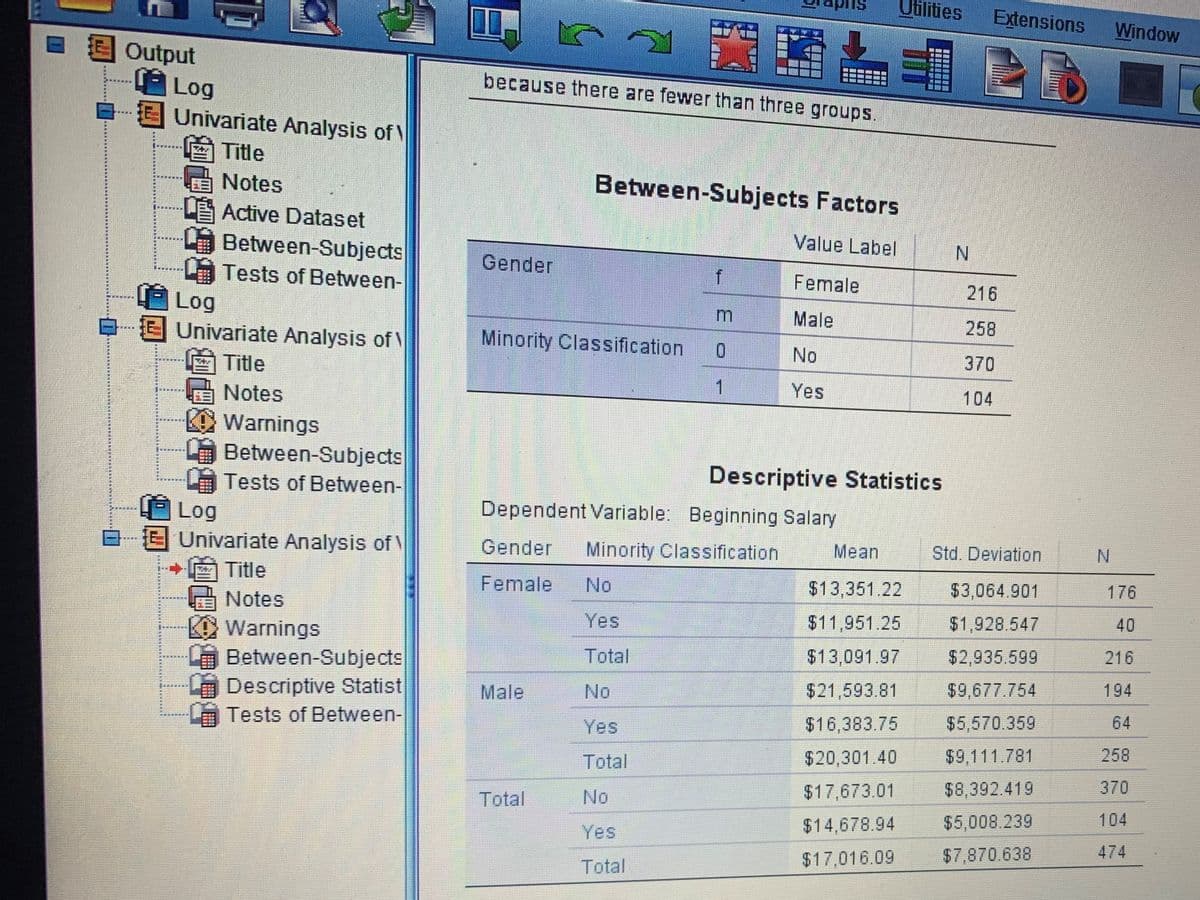
(a). Describe the main effect of minority classification:

The overall mean and standard deviation of minority classification are $17016.09 and $7870.638.

The null and alternate hypotheses are stated below:

Null hypothesis H0:

H0: Main effect of minority classification is not significant.

Alternative hypothesis H1:

H1: Main effect of minority classification is significant.

From the above obtained output below values are reported:

The F-test statistic is F = 18.288.

The numerator degrees of freedom is d.fNum = 1

The denominator degrees of freedom is d.fdenom = 470.

The P-value is P-value = 0.00.

steps

Step by step

Solved in 2 steps

Blurred answer
Knowledge Booster
Anova and Design of Experiments
Learn more about
Need a deep-dive on the concept behind this application? Look no further. Learn more about this topic, statistics and related others by exploring similar questions and additional content below.
Recommended textbooks for you
College Algebra (MindTap Course List)
Algebra
ISBN:
9781305652231
Author:
R. David Gustafson, Jeff Hughes
Publisher:
Cengage Learning