The following table summarizes the results of a study on SAT prep courses, comparing SAT scores of students in a private preparation class, a high school preparation class, and no preparation class. Use the information from the table to answer the remaining questions. ETTE Treatment Number of Observations Sample Mean Sum of Squares (SS) Private prep class 50 680 220.500.00 High school prep class 50 650 229.320.00 No prep class 50 635 251,370.00 Using the data provided, complete the partial ANOVA summary table that follows. (Hint: T, the treatment total, can be calculated as the sample mean times the number of observations. G, the grand total, can be calculated from the values of T once you have calculated them.) Source Sum of Squares (SS) df Mean Square (MS) Between treatments Within treatments ANOVA summary tables typically have a "Total" row not included in the partial table you just completed. Which of the following is a possible reason for including this row? O The MSLotal is used in the calculation of the F test statistic. O The SStotal is used in the calculation of the F test statistic. O The SStotal is sometimes easier to calculate than SSbetween. Since SSwithin + SSbetween = SStotal, you can use SStotal to calculate SSbetwoen- O The total sums of squares is the sometimes called the "error term." In ANOVA, the F test statistic is the v of the between-treatments variance and the within-treatments variance. The value of the F test statistic is When the null hypothesis is true, the F test statistic is When the null hypothesis is false, the F test statistic is most likely
The following table summarizes the results of a study on SAT prep courses, comparing SAT scores of students in a private preparation class, a high school preparation class, and no preparation class. Use the information from the table to answer the remaining questions. ETTE Treatment Number of Observations Sample Mean Sum of Squares (SS) Private prep class 50 680 220.500.00 High school prep class 50 650 229.320.00 No prep class 50 635 251,370.00 Using the data provided, complete the partial ANOVA summary table that follows. (Hint: T, the treatment total, can be calculated as the sample mean times the number of observations. G, the grand total, can be calculated from the values of T once you have calculated them.) Source Sum of Squares (SS) df Mean Square (MS) Between treatments Within treatments ANOVA summary tables typically have a "Total" row not included in the partial table you just completed. Which of the following is a possible reason for including this row? O The MSLotal is used in the calculation of the F test statistic. O The SStotal is used in the calculation of the F test statistic. O The SStotal is sometimes easier to calculate than SSbetween. Since SSwithin + SSbetween = SStotal, you can use SStotal to calculate SSbetwoen- O The total sums of squares is the sometimes called the "error term." In ANOVA, the F test statistic is the v of the between-treatments variance and the within-treatments variance. The value of the F test statistic is When the null hypothesis is true, the F test statistic is When the null hypothesis is false, the F test statistic is most likely

Holt Mcdougal Larson Pre-algebra: Student Edition 2012
1st Edition
ISBN:9780547587776
Author:HOLT MCDOUGAL
Publisher:HOLT MCDOUGAL
Chapter11: Data Analysis And Probability
Section: Chapter Questions
Problem 6CST

Related questions
Question
answer all the question and blanks according to what it asks
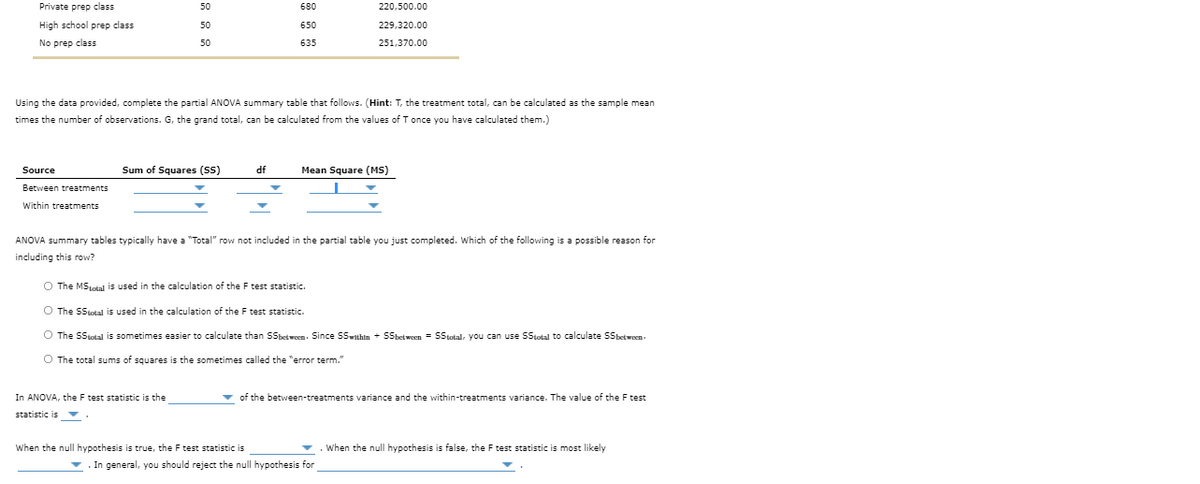
Transcribed Image Text:Private prep class
50
680
220,500.00
High school prep class
50
650
229,320.00
No prep class
50
635
251,370.00
Using the data provided, complete the partial ANOVA summary table that follows. (Hint: T, the treatment total, can be calculated as the sample mean
times the number of observations. G, the grand total, can be calculated from the values of T once you have calculated them.)
Source
Sum of Squares (SS)
df
Mean Square (MS)
Between treatments
Within treatments
ANOVA summary tables typically have a "Total" row not included in the partial table you just completed. Which of the following is a possible reason for
including this row?
O The MStotal is used in the calculation of the F test statistic.
O The SStotal is used in the calculation of the F test statistic.
O The SStotal is sometimes easier to calculate than SSbetwoen. Since SSwithin + SSbetween = SStotal, you can use SStotal to calculate SSbetwoen-
O The total sums of squares is the sometimes called the "error term."
In ANOVA, the F test statistic is the
v of the between-treatments variance and the within-treatments variance. The value of the F test
statistic is
When the null hypothesis is true, the F test statistic is
. When the null hypothesis is false, the F test statistic is most likely
In general, you should reject the null hypothesis for
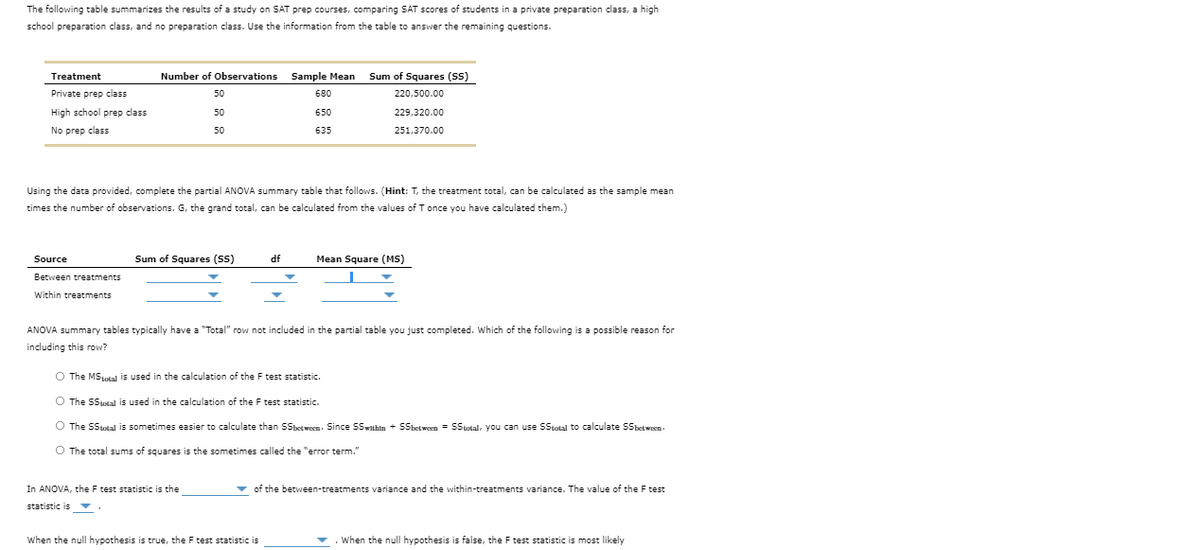
Transcribed Image Text:The following table summarizes the results of a study on SAT prep courses, comparing SAT scores of students in a private preparation class, a high
school preparation class, and no preparation class. Use the information from the table to answer the remaining questions.
Sum of Squares (SS)
ETTE
Treatment
Number of Observations
Sample Mean
Private prep class
50
680
220,500.00
High school prep class
50
650
229,320.00
No prep class
50
635
251,370.00
Using the data provided, complete the partial ANOVA summary table that follows. (Hint: T, the treatment total, can be calculated as the sample mean
times the number of observations. G, the grand total, can be calculated from the values of T once you have calculated them.)
Source
Sum of Squares (SS)
df
Mean Square (MS)
Between treatments
Within treatments
ANOVA summary tables typically have a "Total" row not included in the partial table you just completed. Which of the following is a possible reason for
including this row?
O The MStotal is used in the calculation of the F test statistic.
O The SStotal is used in the calculation of the F test statistic.
O The SStotal is sometimes easier to calculate than SSbetwoen. Since SSwithin + Sbetween = SStotal, you can use SStotal to calculate SSbetwoen.
O The total sums of squares is the sometimes called the "error term."
In ANOVA, the F test statistic is the
v of the between-treatments variance and the within-treatments variance. The value of the F test
statistic is v
When the null hypothesis is true, the F test statistic is
When the null hypothesis is false, the F test statistic is most likely
Expert Solution
This question has been solved!
Explore an expertly crafted, step-by-step solution for a thorough understanding of key concepts.

This is a popular solution!

Trending now
This is a popular solution!

Step by step
Solved in 3 steps with 3 images

Recommended textbooks for you
Holt Mcdougal Larson Pre-algebra: Student Edition…
Algebra
ISBN:
9780547587776
Author:
HOLT MCDOUGAL
Publisher:
HOLT MCDOUGAL

Holt Mcdougal Larson Pre-algebra: Student Edition…
Algebra
ISBN:
9780547587776
Author:
HOLT MCDOUGAL
Publisher:
HOLT MCDOUGAL