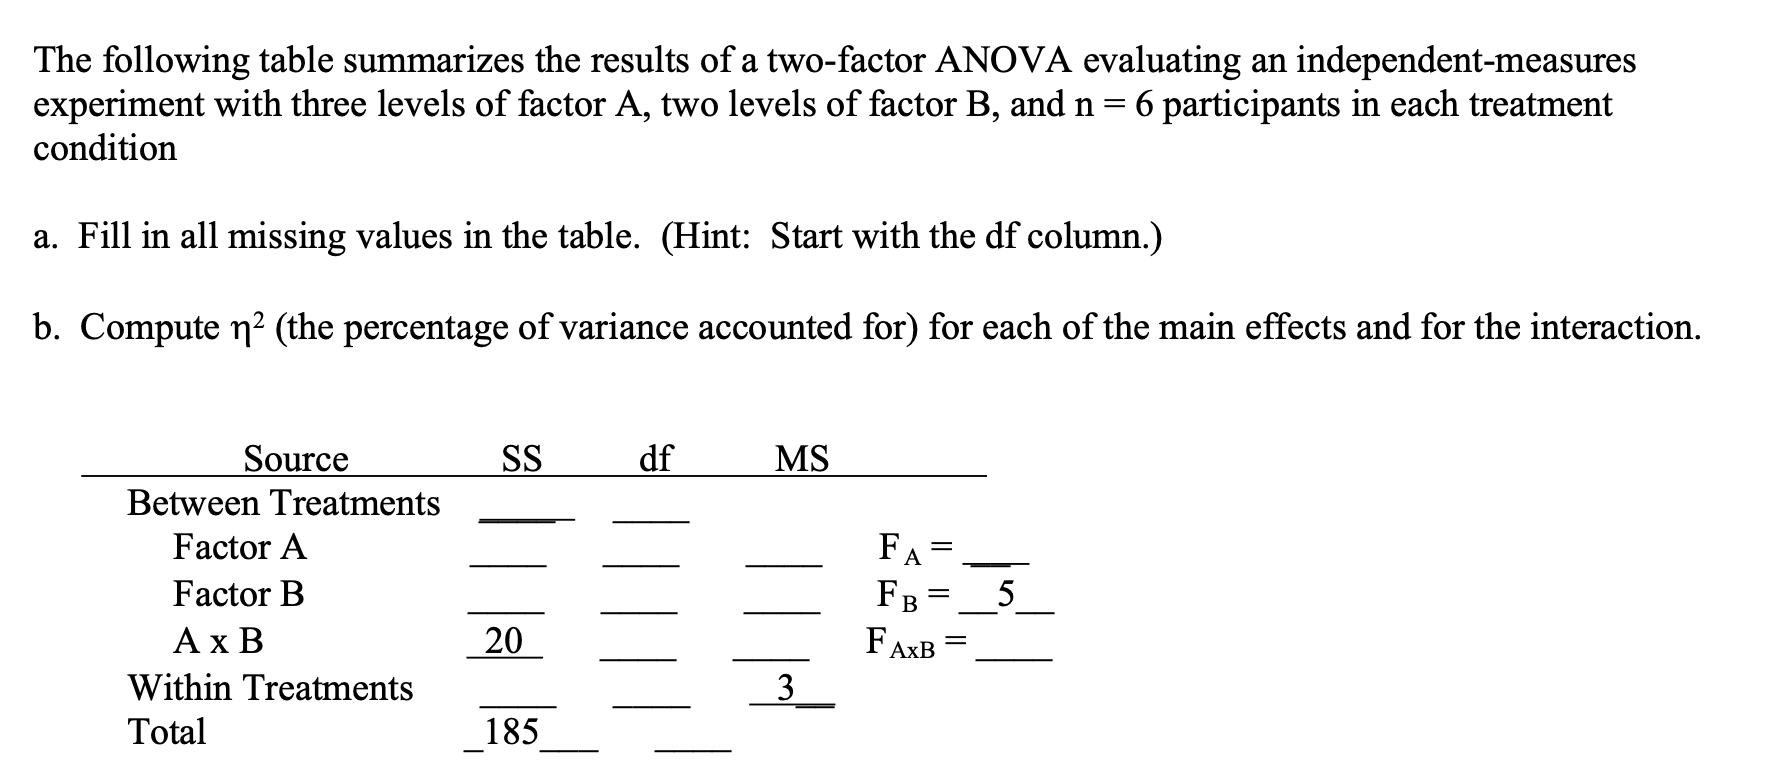
The following table summarizes the results of a two-factor ANOVA evaluating an independent-measures experiment with three levels of factor A, two levels of factor B, and n = 6 participants in each treatment condition a. Fill in all missing values in the table. (Hint: Start with the df column.) b. Compute n² (the percentage of variance accounted for) for each of the main effects and for the interaction. Source SS df MS Between Treatments Factor A FA Factor B Fв - 5 Ах В 20 FAXB Within Treatments 3 Total 185


Q: A sample of 15 maple trees in Vermont were treated with one of three amounts of fertilizer, Low…
A: From the information given,number of trees per groups r=5 and the mean sum of squares of error is…
Q: 20. The following data summarize the results from an independent-measures study comparing three…
A: a)The null and alternative hypotheses are shown below:
Q: Analysis of Variance Source df SS MS F p Factor 3 36.14 12.05 8.37 0.002 Error 13 18.74 1.44…
A: The provided information is Source df SS MS F p Factor 3 36.14 12.05 8.37 0.002 Error 13…
Q: The summary of a randomized block experiment with four groups and eight blocks is given below in the…
A: From the given information, total number of groups c = 4. Total number of blocks r = 8. The ANOVA…
Q: In a study of a new method of teaching arithmetic, claimed to improve on conventional techniques,…
A:
Q: The data below are from an independent-measures experiment comparing three different treatment…
A: Given Information: Treatment1 Treatment2 Treatment3 0 1 4 0 4 3 0 1 6 2 0 3
Q: The accompanying table presents data on yields relating to resistance to stain for three materials…
A: Given: M1 M2 M3 A 5 9 7 B 3 8 4 C 8 13 9 D 4 6 8
Q: The following values are from an independent-measures study comparing three treatment conditions. I…
A: The required variance for treatment I can be obtained as:
Q: 1. The data shown below represent the number of hours of pain relief provided by 5 different brands…
A:
Q: Consider the following data obtained for two samples selected at random from two populations that…
A: Given: Sample I Sample II32 2726 3531 3320 4027…
Q: 1. A psychologist would like to research if the Hope scale (Synd those living in City A, City B and…
A: One way analysis of variance is used to compare more than three population means. If the P value is…
Q: The data in table below represent the number of hours of pain relief provided by 5 different brands…
A: hypothesis null hypothesis : there is no significance difference between mean number of hours of…
Q: The following data summarize the results from an independent-measures study comparing three…
A:
Q: The following data were obtained from an independent-measures study comparing three treatment…
A: Note: Hi there! Thank you for posting the question. As your question has more than 3 parts, we have…
Q: The following data summarize the results from an independent-measures study comparing three…
A:
Q: The following table shows the results of a one-way analysis of variance comparing three treatment…
A: Option a
Q: The data in the table below represent the number of hours of pain relief provided by 5 different…
A: The question is about one - way ANOVA Given :
Q: An experiment was run to determine whether four specific firing temperatures affect the density of a…
A: Introduction: It is required to test whether the different firing temperatures affect the density.
Q: The following data were obtained in a study using three separate samples to compare three different…
A:
Q: A senior accounting major at Midsouth State University has job offers from four CPA firms. To…
A: The following information has been provided: Analysis of Variance Source df SS MS F p Factor…
Q: Consider the experimental results for the following randomized block design. Make the calculations…
A: Given:The given experimental design is RBD.α=0.05Find:1.State the conclusion2.Define…
Q: The following output summarizes a portion of the results for a two-way analysis of variance…
A: For the given data Find and fill the table and make conclusion
Q: Suppose we are conducting the following hypothesis test at the 10% significance level. HO: µ1 - µ2 =…
A:
Q: A senior accounting major at Midsouth State University has job offers from four CPA firms. To…
A: Hypotheses: Null hypothesis: there is no difference in the mean number of months before receiving a…
Q: The following data summarize the results from an independent-measures study comparing three…
A: Given:
Q: The summary of a randomized block experiment with four groups and eight blocks is given below in the…
A: FSTAT = 5.444 GIVEN
Q: 30 43 36 30 44 35 26 46 36 32 48 40 Sample mean 30 45 36 Sample variance…
A: Given data: Treatment A Treatment B Treatment C 32 44 33 30 43 36…
Q: The following table shows the results of a two-factor analysis of variance with 2 levels of factor…
A: Starting with DF, total number of observations = (3 x 2 x 5) = 30. So, DF for total = 30 – 1 = 29.…
Q: a. What are the null and alternate hypotheses? b. What is the test statistic? (Round your…
A: Given that Analysis of Variance Source df SS MS F p Factor 3 39.56 13.19 9.77 0.001 Error…
Q: The manager of a computer software company wishes to study the number of hours senior executives by…
A: Given that ; A anova ( analysis of variance) table is given by using anova concept we solve the…
Q: alculate the difference scores and MD. b. Compute SS, sample variance, and estimated standard…
A: The data given is as follows B A 7 8 2 9 4 6 5 7 5 6 3 8 Sample size (n) = 6 α =…
Q: The following data were collected for a two-factor ANOVA with two treatments and three blocks.…
A: Given: Block Treatment 1 Treatment 2 A 48 36 B 36 22 C 45 37
Q: The following data are from a completely randomized design. Treatment A B 162 142 126 142 156 122…
A: List of formulae : Sum of squares between treatment : SSTr = n1(x¯1 -x¯)2+n2(x¯2 -x¯)2+n3(x¯3 -x¯)2…
Q: In a study of a new method of teaching arithmetic, claimed to improve on conventional techniques,…
A: Assume that the variance of scores for Group A (1st population) is σ12 and the variance of scores…
Q: The following table shows the results of a two-factor analysis of variance with two levels of factor…
A: It is given that there are two levels of factor A, three levels of factor B, and sample of 5…
Q: he data below are from an independent-measures experiment comparing three different treatment…
A: It is given that the data of 3 different treatments and each contains 4 samples.
Q: A carpet manufacturer is studying the differences between two of its major outlet stores. The…
A:
Q: Given that the interaction is significant, you can reanalyze the data with the two factors collapsed…
A:
Q: For a two-factor ANOVA with two levels of factor A, two levels of factor B, and a separate sample of…
A: Given data n=8 The two means for level A1 are 3 and 5 The two means for level A2 are 4 and 2
Q: 1. Which of the following is consistent with the null hypothesis for the interaction of factors A…
A: The null hypothesis for in two factor ANOVA is that there is no interaction effect.
Q: The following table shows the results of a repeated-measures analysis of variance comparing three…
A: Gien that; n = 9 MS ( between) = 15 F test = 3.0 By using the formula of F test we solve this…
Q: The following table shows the results of a two-factor analysis of variance with 2 levels of factor…
A:
Q: The following table shows the results of a two-factor analysis of variance with 2 levels of factor…
A: Total number of observations = 3×2×5 = 30.Total degrees of freedom = 30-1 = 29.There are two levels…
Q: The number of calories contained in ½ cup servings of randomly selected flavors of ice cream from…
A: Given information: The data represents the number of calories contained in ½ cup servings for a…
Q: A researcher has used a one-way analysis of variance model to test whether the average starting…
A: Source SS DF MS F Treatment 72 3 24 6 Error 48 12 4 Total 120 15
Q: The following data represent the results from an independent-measures experiment comparing three…
A: Hello! As you have posted 2 different questions, we are answering the first question. In case you…
Q: The following table shows the results of a two-factor analysis of variance with 2 levels of factor…
A: The sum of squares between is 80, the sum of squares due to factor A is 8, and the mean square due…
Q: Given the ANOVA table below, what is the % Contribution for the Repeatability variance component?…
A: Variance Component for ANOVA method: The VarComp of the repeatability is the mean square error of…
Q: Consider the experimental results for the following randomized block design. Make the calculations…
A: The experimental results for a randomized block design is given as :


Trending now
This is a popular solution!

Step by step
Solved in 3 steps with 20 images

- What is meant by the sample space of an experiment?The following table shows the results of a two-factor analysis of variance with 2 levels of factor A, 3 levels of factor B, and a separate sample of n = 5 participants in each of the treatment conditions. Note that several values are missing in the table. What is the missing value for the F-ratio for the AxB interaction? Source SS df MS Between 80 xx A 8 xx xx F = xx B xx xx 20 F = xx AxB xx xx xx F = xx Within xx xx xx Total 176 xx Question options: a. 4 b. 2 c. 16 d. 8A carpet manufacturer is studying the differences between two of its major outlet stores. The company is interested in the time it takes for customers to receive carpeting that has been ordered from the plant. Data concerning a sample of delivery times for the most popular type of carpet are summarized as follows: Acme Store Betty’s Store x̄ 43.7 days 34.3 days s 3.1 days 2.4 days n 31 orders 41 orders Assuming equal variances, determine at the 5% level of significance, if there is enough evidence from the sample data to conclude that Acmes’ store must wait on average significantly longer for the carpet to be delivered than Betty’s store? Then calculate and interpret a (1-α)% CI for µA - µB. Does the interval estimate for µAcme - µBetty’s support the decision? Explain. Recall that we only use the p-value decision rule for 2 sample t-tests.
- A low-level CDC bureaucrat wants to please his boss by gathering evidence thatthe current government-mandated shutdown of society is not causing people’s mentalhealth to deteriorate, so that it can safely be continued for several years if anyexpert says it’s necessary.He polls a random sample of 1600 citizens, gathering data on such items asincome loss, weight gain, access to toilet paper, hours spent binge-watchingNetflix, and number of injuries caused by household fights, and compiles all thisinto a scientifically-weighted “misery index”.The mean misery index from the sample is 99.2; it seems reasonable to use apopulation standard deviation σ = 19.1.a) Does this information provide significant evidence (at the 5% level) that thenationwide mean misery index is less than 100? Set up appropriate null andalternative hypotheses, calculate the appropriate test statistic, find the P-value,and state your conclusion. (10)b) A CDC press release publishing the results of this study claims that…A low-level CDC bureaucrat wants to please his boss by gathering evidence thatthe current government-mandated shutdown of society is not causing people’s mentalhealth to deteriorate, so that it can safely be continued for several years if anyexpert says it’s necessary.He polls a random sample of 1600 citizens, gathering data on such items asincome loss, weight gain, access to toilet paper, hours spent binge-watchingNetflix, and number of injuries caused by household fights, and compiles all thisinto a scientifically-weighted “misery index”.The mean misery index from the sample is 99.2; it seems reasonable to use apopulation standard deviation σ = 19.1.a) Does this information provide significant evidence (at the 5% level) that thenationwide mean misery index is less than 100? Set up appropriate null andalternative hypotheses, calculate the appropriate test statistic, find the P-value,and state your conclusion. b) A CDC press release publishing the results of this study claims that…"A large candy manufacturer produces, packages and sells packs of candy targeted to weigh 52 grams. A quality control manager working for the company was concerned that the variation in the actual weights of the targeted 52-gram packs was larger than acceptable. That is, he was concerned that some packs weighed significantly less than 52-grams and some weighed significantly more than 52 grams. In an attempt to estimate the variance of the weights of all of the 52-gram packs the manufacturer makes, he took a random sample of n = 20 packs off of the factory line. The random sample yielded a sample variance of 3.5 grams. Use 90% confidence level. What is the confidence interval for the variance of the weight of the candy?"
- A researcher has used a one-way analysis of variance model to test whether the average starting salaries differ among recent graduates from the nursing, engineering, business, and education disciplines. She has randomly selected four graduates from each of the four areas. If MSE = 4, and SSTO = 120, complete the following ANOVA table. Is there a significant difference in the starting salaries among the four disciplines? (H0: No difference) Source SS DF MS F Treatment Error 4 Total 120A sample of 15 maple trees in Vermont were treated with one of three amounts of fertilizer, Low (group 1), Medium (group 2) and High (group 3). The volume in sap (measured in mL) produced by each tree was recorded, and a Single-Factor ANOVA test was performed, which ended up rejecting . The Summary table and the ANOVA table produced by Excel are given below: SUMMARY Groups Count Sum Average Variance Low 5 398.1 79.62 27.572 Medium 5 477.2 95.44 3.703 High 5 445.1 89.02 11.357 ANOVA Source of Variation SS df MS F Between Groups 633.0813333 2 316.5406667 22.27486395 Within Groups 170.528 12 14.21066667 Total 803.6093333 14 If you follow up the ANOVA test with a FORMAL Fisher's LSD Pairwise Comparison (PWC) test on , then use the information provided in the Excel-generated output to calculate the value of the Test Statistic (TS) that you would use to perform this PWC test. Round off your final answer to the…The marketing manager of a large super-market chain has the business objective of using shelf space most efficiently. Toward that goal, they would like to use shelf space to predict the sales of a specialty pet food. Data are collected from a random sample of 12 equal-sized store, with the following results: Shelf Space Sales Aisle Location 5 160 0 5 220 1 5 140 0 10 190 0 10 240 0 10 260 1 15 230 0 15 270 0 15 280 1 20 260 0 20 290 0 20 310 1 For these data, Syx = 30.8058436 and hi = 0.1373333 when X = 8. *Round final answers below to three decimal places. Do not round calculations until the final answer. (a) Construct a 95% confidence interval estimate of the mean weekly sales for all stores that have 8 square feet of shelf space for pet food. (b) Construct a 95% prediction interval of the weekly sales of an individual store that has 8 square feet of shelf…
- The following table shows the results of a two-factor analysis of variance with two levels of factor A, three levels of factor B, and a separate sample of n = 5 participants in each of the treatment conditions. Note that several values are missing in the table (indicated by "xx"). What is the value for the F-ratio for the A x B interaction? Source SS df MS Treatment 80 xx A 8 xx xx F = xx B xx xx 20 F = xx A x B xx xx xx F = xx Error. xx x xx Total 176 xxFour experimenters determine the moisture content of samples of a powder, each mantaking a sample of six consignments. Their assessments are: Consignments Observers 1 2 3 4 5 6 1 9 10 9 10 11 11 2 12 11 9 11 10 10 3 11 10 10 12 11 10 4 12 13 11 14 12 10 (a) Perform a two-way analysis of variance on these data and discuss whether there is any significant difference between consignments and between observers.(b) Subtract 10 from each value of the data and then perform a two-way analysis of variance on these data and discuss whether there is any significant difference between consignments and between observers. also discuss the results obtained from part (a) and part (b) what change occurs after subtracting 10 from each value of the dataAnnie is concerned over a report that "a woman over age 4040 has a better chance of being killed by a terrorist than of getting married." A study found that the likelihood of marriage for a never-previously-wed, 4040-year-old university-educated American woman was 2.8%2.8%. To demonstrate that this percentage is too small, Annie uses her resources at the Baltimore Sun to conduct a simple random sample of 513513 never-previously-wed, university-educated, American women who were single at the beginning of their 4040s and who are now 4545. Of these women, 2323 report now being married. Does this evidence support Annie’s claim, at the 0.050.05 level of significance, that the chances of getting married for this group is greater than 2.8%2.8%? Step 3 of 3 : Draw a conclusion and interpret the decision.