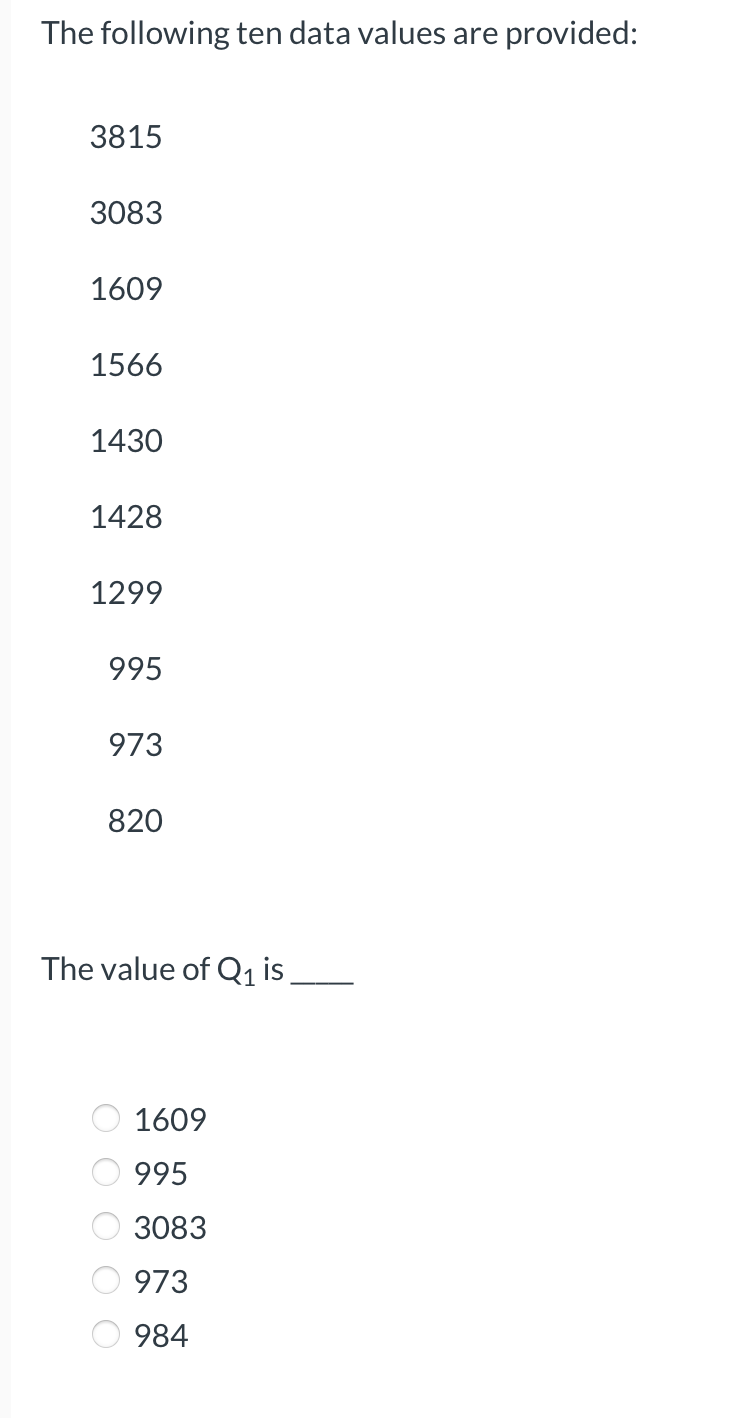
The following ten data values are provided: 3815 3083 1609 1566 1430 1428 1299 995 973 820 The value of Q1 is. 1609 995 3083 973 984 O O O O O


Q: Using the given data, find the following. 5 24 20 18 21 11
A: The ascending order of the given data is given below:5, 11, 18, 20, 21, 24
Q: Find the interquartile range for the following two data sets and compare them. Test Scores for Class…
A: The given test scores for class A : 65, 66, 67, 69, 69, 76, 77, 77, 79, 80, 81, 83, 85, 89, 90, 91,…
Q: The following ten data values are provided: 3815 3083 1609 1566 1430 1428 1299 995 973 820 The 80th…
A: The number of observations is, n=9. 29) The data values are sorted in ascending order is, 820, 973,…
Q: Find the 5 number summary for the data shown below. 97 65 62 83 85 7 3 15 94 87 5 number…
A: Writing the numbers is ascending order(from smallest to largest) 3, 7, 15, 62, 65, 83, 85, 87, 94,…
Q: Construct a boxplot for the data set below. 95 95 95 97 90 89 90 85 91 84 89 91 92 89 89 89 88 89 91…
A: We have given that, The data set is, 95, 95, 95, 97, 90, 89, 90, 85, 91, 84, 89, 91, 92, 89, 89,…
Q: Based on this histogram, draw the ogive (the cumulative frequency polygon) for the Accu-Rating data.…
A: From the histogram the frequency table is, Aggregate tuning hours Frequency 200 - 400 4 400 -…
Q: The monthly incomes of 10 families in a town is given below. You are required to calculate mean. 1 2…
A:
Q: Use the given data set to complete parts (a) through (c) below. (Use a = 0.05.) 10 8 13 9 11 14 6 4…
A:
Q: Estimate the following specification, ỹ=b,+b1*X, given the following data y 3 6. 13 9 15 12 27
A: The regression analysis is obtained using EXCEL: Select Data > Data analysis > Regression…
Q: Here is a set of data. 50 205 208 218 221 229 254 477 547 654 670 777 890 910 958 970 Identify the 5…
A: Here we have to find dive number summary Given data is 50 205 208 218 221 229 254 477 547 654 670…
Q: Given the data, find the relative frequency between 12-15 Grade Frequency 0 - 3 3 4 - 7 7 8 – 11 9.…
A:
Q: Complete the following table: Grade on Statistics Relative Exam Frequency Frequency .08 A: 90-100 B:…
A:
Q: Here is a set of data. 105 148 208 441 459 466 476 537 570 571 596 655 904 919 Identify the 5 number…
A: From the provided information, The number of observations (n) = 14
Q: What is the mode of the data shown in the following table? Measure Frequency (X) 12 13 18 m254
A: Mode: Mode is the value that occurs most frequently in a data set.
Q: For the following pairs of data points (10, 100), (8, 120), (5, 200), (4, 200), (10, 90), (7, 1, and…
A: The data can be entered in excel as:
Q: Provide 1 interpretation on the following graphic (histogram). Histogram of x 10 800 1600 2400 3200…
A: Given the histogram,
Q: Use 6-point bins (94 to 99, to 88 to 93, etc.) to make a frequency table for the set of exam…
A:
Q: Here is a set of data. 15 324 352 360 364 392 621 622 707 727 792 838 Identify the 5 number summary…
A: To identify the 5 number summary for the given data: 15, 324, 352, 360, 364, 392, 621, 622, 707,…
Q: The following data represents the age of 30 lottery winners. 23 32 32 33 34 36 37 40 43 44 48 49 52…
A:
Q: Calculate (x-bar) for the data shown, to two decimal places 17.9 2.6 6.3 16.4 24.2 26.1 18.7 18.4…
A: Calculate Mean from the following data17.9,2.6,6.3,16.4,24.2,26.1,18.7,18.4,9.1,5.7
Q: For the given set of data: 67 67 64 64 74 61 68 71 69 64 65 64 62 63 64 Determine: (а) Мean (b)…
A: As per guidelines expert have to answer first question three subparts only dear student please…
Q: Find the 5 number summary for the data shown 2 12 19 23 38 40 57 68 90 99 5 number summary:
A:
Q: Complete the stemplot for the following data. 30 31 46 47 45 37 46 48 45 32 33 41 45 55 41 45 30 46…
A: Data is given.Total number of observations = 30
Q: 27 23 48 30 31 15 30 34 22 32 30 32 27 23 16 43 31 27
A:
Q: Construct a boxplot for the data
A: arrange the data in ascending order data in ascending order is: 41.0, 45.0, 46.0, 53.0, 57.0,…
Q: Ten novels were randomly selected, and the number of pages were recorded as follows: 415 398 402 399…
A:
Q: Find the range for the given data set. Fred, a local mechanic, gathered the following data regarding…
A:
Q: State the Five Number Summary for the following dataset. 44 45 46 47 49 51 54 55 58…
A:
Q: Construct an ordered stem and leaf display for the following data. 112 129 114 125 135 106 139 142…
A: Obtain the stem and leaf plot for the given data. The stem and leaf plot is constructed below as…
Q: Find the measures of center for following. Data Frequency 40 44 1 45 49 50 54 55 59 60 64 5 11 16 65…
A: Hi! Thanks for posting the question. Since there are more than one question, we will answer first…
Q: The following data are the monthly salaries and the grade point averages for students who obtained a…
A:
Q: Construct a scatterplot for the given data. 0.33 0.92 0.36 0.29 -0.09 0.97 0.39 0.3 y 0.5 0.49 0.08…
A: Step-by-step procedure to draw scatter plot using Excel: In Excel sheet, enter x and y in different…
Q: The following data are the number of pages in 40 books on a shelf. 131; 140; 178; 190; 205; 215;…
A: The data shows the number of pages in 40 books on a shelf.
Q: Using the given data below, compute the following statistics: 90…
A: The minimum value is 60 and the maximum value is 98.
Q: Obtain the five-number summary for the given data. The normal annual precipitation (in inches) is…
A: Use EXCEL Procedure to obtain the value of first quartile. Follow the instruction to obtain the…
Q: State the Five Number Summary for the following dataset. 0.03 0.04 0.05 0.07 0.08 0.09…
A: given data in ascending order; number of…
Q: The highest temperatures ever recorded (in °F) in 32 different U.S. states are shown below.…
A: Given: 100 109 115 118 100 110 115 119 105 110 116 120 105 112 117…
Q: Find the interquartile range of the data set. 0 1 2 3 4 O 2.5 O 1.5 O 2 O 4
A:
Q: Frequency 10+ 8+ 6- 4- 2 1 35 79 data 9 11 13
A: Based on the histogram given below, to determine the frequency of the class containing the value 6.…
Q: Use 4-point bins (96 to 99,92 to 95,etc.) to make a frequency table for the set of exam scores…
A: To make a frequency table, we will first sort the data.
Q: Complete the stemplot for the following data. 30 31 46 47 45 37 46 48 45 32 33 41 45 55 41 45 30 46…
A:
Q: Given the following data. Find the Range: 16, 25, 4, 18, 11, 13, 20, 8, 11, 9 اختر احدى الدجابات О…
A:
Q: The arithmetic mean of the following data is Marks Frequency 18 4 30 85 3 90 75 3 O 1.50 103.20 O…
A:
Q: The cross-tabulation data given below show the number of people who rated a customer service…
A: Given that Observed Frequencies B1 B2 Total A1 13 4 17 A2 16 20 36 Total 29 24 53 need…
Q: Using the given data below, compute the following statistics: 80…
A: Given : 80, 110, 83, 78, 60, 73, 89, 81, 94 a) mean = ∑Xin mean = 7489 mean = 83.11 b) Arrange the…
Q: The scores of 15 students on the basic statistics exam are as follows: 70 82 90 92 96 84 85 75 76 78…
A:
Q: A store manager counts the number of customers who make a purchase in his store each day. The data…
A: Introduction: To solve the problem, first arrange the data in an ascending order as follows: 7, 7,…
Q: For the given set of data: 138 164 150 132 144 125 149 157 144 158 140 147 136 148 144 Determine:…
A: As per bartleby guideline expert have to answer first three subpart only dear student please upload…
Q: Here is a set of data. 96 166 199 200 236 238 242 250 295 477 485 508 597 786 804 903 990 Identify…
A: Total number of data point (n) = 18
Q: Ten novels were randomly selected, and the number of pages were recorded as follows: 415 398…
A: We have given that 415,398,402,399,400,405,395,401,412,407 Now we arrange the given data in…
Question 30

Step by step
Solved in 2 steps
