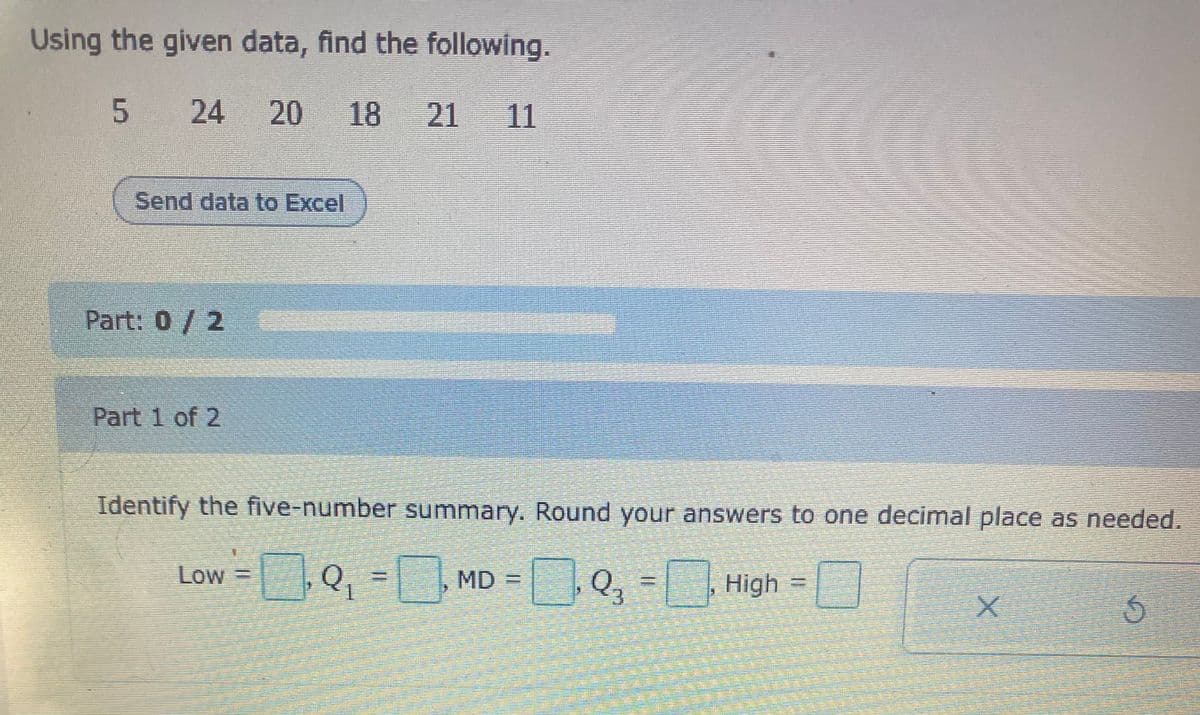
Using the given data, find the following. 5 24 20 18 21 11


Q: Find the mean for the following data set: 29 35 20 32 25 16 27 26.2 6.6 19
A: Ans#- Given data 29, 35, 29, 32, 25, 16 Find the mean
Q: Complete the following frequency distribution table for the ratio variable, Years Employed (Type…
A: The frequency distribution table is obtained by using EXCEL. The software procedure is given below:…
Q: Use the following data set: 13, 8, 10, 7, 13, 9, 7, 11, 12, 10, 13 to answer questions The range of…
A: Given Data: 13, 8, 10, 7, 13, 9, 7, 11, 12, 10, 13 Highest value=13 Lowest value=7
Q: 6 7 8 9 10 11 12 13 14 15 16 17 18 19 20 data Based on the boxplot above, identify the 5 number…
A: Boxplot
Q: Using the following stem & leaf plot, find the five number summary for the data by hand. 1|55 2107 9…
A:
Q: 1 2 3 Households 26 406 6
A: According to the data,The number of televisions (HD) per household in a small town…
Q: For the data set below, find the IQR. 64 74 74 68 70 73 61 70 59 76 77 Send data to Excel
A: Interquartile Range(IQR), is the difference between the middle term of lower half of the data on the…
Q: Using the given data below, compute the following statistics: 90 100 83 78 60 73 89 81 94 a) Mean b)…
A: a) The mean of the data is given as Mean=Sum of all observationsTotal number of…
Q: Use the given data test the indicated X S a Me 10 191 96.7 37.5 0.05 M²90
A: Given that n=191 x=96.7s=37.5α=0.05
Q: Find the mean of the following sets of data.
A:
Q: In the data set below, what is the lower quartile? 12 18 23 30 35 42 48 72 75 91 98
A: The lower quartile or the first quartile is the observation below which 25% of the observations of…
Q: Find the range of the data set. * 21 22 23 24 25 26 27 28 O 25 O 8
A: Range of the data is the highest value - lowest value
Q: iven the following data: 14, 13, 9, 12, 5, 15, 17, and 16. Identify the
A: The given data is, 14,13,9,12,5,15,17,1,6 The ascending order of the data is:- 5, 9, 12, 13, 14, 15,…
Q: Using the data given below, determine whether it would unusual for a household to have no HD…
A: Probability(No HD tv)=0.03 Option C is the correct answer.
Q: Q1. Define the following terms: A) Statistics. B) Quantitative data. C) Average:
A: A) Statistics : It is a science of collecting , Analyzing and interpretation of numerical data such…
Q: Make a stemplot for the following data and explain your observations: 13 66 36 12 8 27 7 7 52 48 15…
A: Stem and leaf plot is a graph which split into two parts as stem and leaf. Where stem is usually…
Q: From the given data calculate H.M 5, 10, 17, 24, 30
A: From the given information, x 1/x 5 0.2 10 0.1 17 0.0588 24 0.0417 30 0.0333…
Q: Construct a boxplot for the data
A: arrange the data in ascending order data in ascending order is: 41.0, 45.0, 46.0, 53.0, 57.0,…
Q: Consider the following set of data and answer Questions 9 through 13. 1 3 3 7 8 8. 11 14 15 19 21 21…
A:
Q: Using the following stem & leaf plot, find the five number summary for the data by hand. 31999 412 8…
A: From stem & leaf plot the dataset is,39,39,39,42,48,52,58,61,66,67,68,72,75,77,77,78,80,82 To…
Q: In the data set below, what is the lower quartile? 32 41 43 44 55 65 75 82 84 84 Submit
A:
Q: Use the following data to calculate 1)the number of persons employed 2) the number of persons…
A:
Q: Complete the table below with the following given data.
A: Here AS PER POLICY I HAVE TO CALCULATE FIRST MAIN QUESTION ONLY EVEN THOUGH I HAVE CALCULATED 2…
Q: For the data set below, find the IQR. 65 74 74 68 66 73 63 72 62 75 75
A: Introduction: The formula for the interquartile range or IQR is: IQR = Q3 – Q1; Where Q1 is the…
Q: A Give the original data set from the stemplot given below. 4 0 0 1 5 5 2 27 6. 70 7 7 99
A:
Q: Find the five-number summary for the data in the histogram shown. 3 2.5 2 1.5 1 0. 1 2 3 4 5 6 7 8 9…
A: From the histogram: Class Frequency Cumulative Frequency 1-2 1 1 2-3 1 2 4-5 3 5 6-7 1 6…
Q: Given the set of data below, find the range. 25, 16, 50, 19, 42, 37 A) 34 B) 66 C) 50 D) 12
A: Range is the difference between maximum and minimum value. From the given data, Maximum value is 50…
Q: 1. Find the mean of the data set 18, 36, 24, 36, 30, and 36. a. 26 с. 36 b. 27 d. 30
A: Explanation of the answer is as follows
Q: 5) Find the S, for the following data (formula or caleulator). 2 15 19
A: Given information: Total number of observations(n)=4 The data is provided as: X Y X⋅Y X2 Y2…
Q: The following data represent the boxplot and quartiles to decide if 0.89 0.90 0.93 0.94 0 93 0 92 0…
A: The correct answer is C. The following procedure is used to construct a box plot, Enter the data…
Q: 1. Construct the X bar and R bar Chart for the following data.
A: We need to construct Control Charts
Q: What is the mean for the following grouped data: Score Frequency 55 3 60 1 65 70 6. 75 4 80 6. 85 90…
A: Calculation of ∑f and ∑fx:
Q: For the data in the following table, what is the value of EX? 1 2 2 4 2 4 1
A:
Q: A national survey of graduate students is conducted to assess their consumption of coffee. The…
A: The total number of graduate students is, 145+80+94+121+365+430=1235.
Q: Determine whether r is positive, negative, or zero for each of the following data sets. 80 (c) (b)…
A: We know that the correlation coefficient is i. greater than 0 if y increases with increase of x ii.…
Q: Create an online survey of your section on "The Devices Available at Home Use for Learning" either…
A: Results of the survey is; Number of people who use smartphone = 20 Number of people who use laptop =…
Q: The service time, in minutes, for 12 customers in a restaurant are given below. What are the data…
A: Given that The data are arrange in increasing order Position X (Asc. Order) 1 6.5 2 6.8 3…
Q: The following data set contains the weights of 30 girls before and after a dietary plan. Compare…
A: In statistics there are two types of measures namely measures of central tendency and…
Q: Construct a stem-and-leaf diagram for the accompanying data, using two lines per stem. 20 30 45…
A: Given 2030454746403734363135353425374542224326
Q: Jse the following histogram shows the final grades of a college algebra class for questions 19-21:…
A: It is an important part of statistics . It is widely used .
Q: Using the given data below, compute the following statistics: 80…
A: Given : 80, 110, 83, 78, 60, 73, 89, 81, 94 a) mean = ∑Xin mean = 7489 mean = 83.11 b) Arrange the…
Q: Find the measures of center for following. Data Frequency 40 44 45 49 50 - 54 7 55 59 14 60 64 23 65…
A: Given data: Data Frequency 40-44 2 45-49 2 50-54 7 55-59 14 60-64 23 65-69 14 70-74…
Q: The arithmetic mean of the following data is Marks Frequency 18 4 30 1 85 90 75 O 64.50
A: Here, x f fx 18 4 72 30 1 30 85 3 255 90 5 450 75 3 225 Total 16 1032
Q: The following are the amount of rainfall in inches 36, 28, 38, 28, 30, 20, 35, 94, 37 and 29. Find…
A: For the ungrouped data : x1, x2, x3, ..., xn The mode of the data is the observation that is…
Q: Find the mode for the following data. Deliveries Each Week Frequency 4 6 8 12 16 1 Mode =
A:
Q: The data set below shows the number of homework assignments Pequ in math classes for a month: 22 23…
A:
Q: Which histogram below shows a data set that is skewed right? O a) 123 4 5 6 7 8 9 10 Data Value Ob)…
A: Question is related to statistics.


Trending now
This is a popular solution!

Step by step
Solved in 3 steps with 2 images

- From the following data points (15, 24), (18, 37), (22, 25), find the Newton’s second-order divided difference. Round-off to three decimals.. Two soft drink dispensing machines should dispense 8 oz of your selection into a cup. The table below shows the data Machine 1 9.52 6.41 10.07 5.85 8.15 Machine 2 8.01 7.99 7.95 8.03 8.02 Which is more consistent in dispensing soda base on the measures of dispersion? Show all solutions.Which of the following is the most appropriate equation to model the data? ŷ = 1.1x + 1.467 ŷ = 1.467x + 1.1 ŷ = 1.1(1.467)x ŷ = 1.467(1.1)x
- The given paired data lists the heights (in inches) of various males who were measured on their eighth and sixteenth birthdays. Height (8 yrs) 52 50 48 51 51 48 (x) Height (16 yrs) 69 66 64 67 69 65 (y) Determine the residual value for an x of 48 and explain its meaning.e. Compute f(1.75) from the following data using Lagrange Interpolation Formula formula givenIs the magnitude of an earthquake related to the depth below the surface at which the quake occurs? Let x be the magnitude of an earthquake (on the Richter scale), and let y be the depth (in kilometers) of the quake below the surface at the epicenter. x 3.1 4.3 3.3 4.5 2.6 3.2 3.4 y 4.8 9.6 11.2 10.0 7.9 3.9 5.5 A) Make a scatter diagram of the data. Use a calculator to verify that Σx = 24.4, Σx2 = 87.80, Σy = 52.9, Σy2 = 448.51 and Σxy = 189.84.B) Compute r. (Round to 3 decimal places.) C) As x increases, does the value of r imply that y should tend to increase or decrease? Explain your answer.
- For an alpha = .10 and degrees of freedom, df = 32, what is the one-tailed t-value? Give your answer exactly as it appears in the table, with three decimal places.The following data represent the muzzle velocity (in feet per second) of rounds fired from a 155-mm gun. For each round, two measurements of the velocity were recorded using two different measuring devices, resulting in the following data. Complete parts (c) through (d) below.The owner of a new car conducts a series of six gas mileage tests and obtains the following results, expressed in miles per gallon: 3., 22.7, 21.4, 20.6, and 21.4. 20.9. Find the mode for these data.
- Here is a bivariate data set.xy182425915011737106295223812246 Find the correlation coefficient and report it accurate to four decimal places. r =A sample of average high temperature during July (x) of cities in Colorado compared to their elevation in feet (y) yields the following results: x 90 75 85 94 89 94 78 76 88 y 5280 9494 6035 4078 6191 4583 8000 8022 5807 Find yx y 0 1750.00 1 1942.50 2 2156.18 3 2393.36 4 2656.63 5 2948.86 a) Find the y-value for the data if the x-value is 8. Show work and/or justify the answer.