The following TI-84 Plus display presents some sample statistics. 1-Var-Stats x=67 Σχ=2291 Σχ=182,361 Sx=8 ax=8.024961059 n=29 Part 1 of 3 (a) Assume that a histogram of the sample is bell-shaped. Approximately what percentage of the sample values are between 51 and 83? Approximately 68% of the sample values fall between 51 and 83. Part 2 of 3 (b) Assume that a histogram for the sample is bell-shaped. Between what two values will approximately 68% of the sample be? Approximately 68% of the sample values will fall between 10 and 50 Part: 2/3 Part 3 of 3 (c) If we do not assume that the histogram is bell-shaped, at least what percentage of the sample values will be between 51 and 83? At least 93.8% of the sample values fall between 51 and 83. X Ś Español
The following TI-84 Plus display presents some sample statistics. 1-Var-Stats x=67 Σχ=2291 Σχ=182,361 Sx=8 ax=8.024961059 n=29 Part 1 of 3 (a) Assume that a histogram of the sample is bell-shaped. Approximately what percentage of the sample values are between 51 and 83? Approximately 68% of the sample values fall between 51 and 83. Part 2 of 3 (b) Assume that a histogram for the sample is bell-shaped. Between what two values will approximately 68% of the sample be? Approximately 68% of the sample values will fall between 10 and 50 Part: 2/3 Part 3 of 3 (c) If we do not assume that the histogram is bell-shaped, at least what percentage of the sample values will be between 51 and 83? At least 93.8% of the sample values fall between 51 and 83. X Ś Español

MATLAB: An Introduction with Applications
6th Edition
ISBN:9781119256830
Author:Amos Gilat
Publisher:Amos Gilat
Chapter1: Starting With Matlab
Section: Chapter Questions
Problem 1P

Related questions
Question
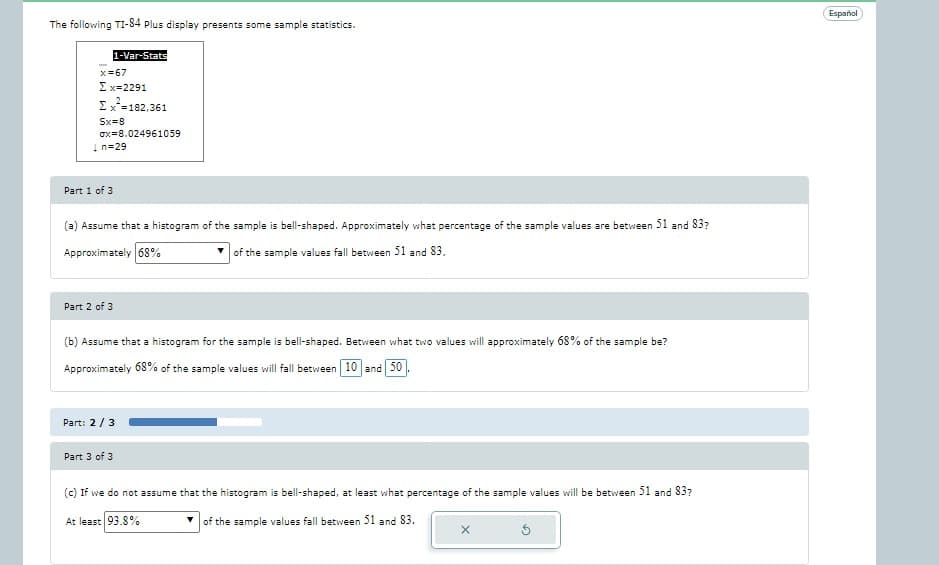
Transcribed Image Text:The following TI-84 Plus display presents some sample statistics.
1-Var-Stats
x=67
Ex=2291
Σχ' 182,361
Sx=8
ax=8.024961059
1 n=29
Part 1 of 3
(a) Assume that a histogram of the sample is bell-shaped. Approximately what percentage of the sample values are between 51 and 83?
Approximately 68%
of the sample values fall between 51 and 83.
Part 2 of 3
(b) Assume that a histogram for the sample is bell-shaped. Between what two values will approximately 68% of the sample be?
Approximately 68% of the sample values will fall between 10 and 50
Part: 2/3
Part 3 of 3
(c) If we do not assume that the histogram is bell-shaped, at least what percentage of the sample values will be between 51 and 83?
At least 93.8%
of the sample values fall between 51 and 83.
X
Ś
Español
Expert Solution
This question has been solved!
Explore an expertly crafted, step-by-step solution for a thorough understanding of key concepts.

This is a popular solution!

Trending now
This is a popular solution!

Step by step
Solved in 3 steps with 2 images

Recommended textbooks for you
MATLAB: An Introduction with Applications
Statistics
ISBN:
9781119256830
Author:
Amos Gilat
Publisher:
John Wiley & Sons Inc

Probability and Statistics for Engineering and th…
Statistics
ISBN:
9781305251809
Author:
Jay L. Devore
Publisher:
Cengage Learning

Statistics for The Behavioral Sciences (MindTap C…
Statistics
ISBN:
9781305504912
Author:
Frederick J Gravetter, Larry B. Wallnau
Publisher:
Cengage Learning
MATLAB: An Introduction with Applications
Statistics
ISBN:
9781119256830
Author:
Amos Gilat
Publisher:
John Wiley & Sons Inc
Probability and Statistics for Engineering and th…
Statistics
ISBN:
9781305251809
Author:
Jay L. Devore
Publisher:
Cengage Learning
Statistics for The Behavioral Sciences (MindTap C…
Statistics
ISBN:
9781305504912
Author:
Frederick J Gravetter, Larry B. Wallnau
Publisher:
Cengage Learning

Elementary Statistics: Picturing the World (7th E…
Statistics
ISBN:
9780134683416
Author:
Ron Larson, Betsy Farber
Publisher:
PEARSON

The Basic Practice of Statistics
Statistics
ISBN:
9781319042578
Author:
David S. Moore, William I. Notz, Michael A. Fligner
Publisher:
W. H. Freeman

Introduction to the Practice of Statistics
Statistics
ISBN:
9781319013387
Author:
David S. Moore, George P. McCabe, Bruce A. Craig
Publisher:
W. H. Freeman