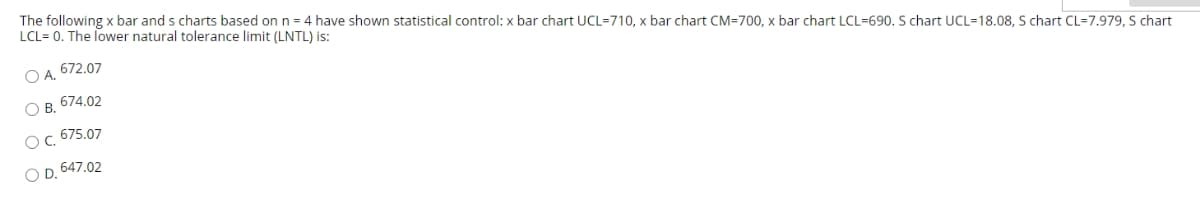
The following x bar and s charts based on n = 4 have shown statistical control: x bar chart UCL=710, x bar chart CM=700, x bar chart LCL=690. S chart UCL=18.08, S chart CL=7.979, S chart LCL= 0. The lower natural tolerance limit (LNTL) is: O A. 672.07 O B. 674.02 OC 675.07 O D. 647.02


Q: The following 10 measurements of the freezing point of aluminum were made using a platinum/rhodium…
A: From the provided information, The data values are as follow: 658.2, 659.8, 661.7, 662.1, 659.3,…
Q: Cadmium, a heavy metal, is toxic to animals. (The chemical abbreviation fo rooms, however, are able…
A: Given data: X 0.24 0.59 0.62 0.16 0.77 1.33 0.92 0.19 0.33 0.25 0.59 0.32…
Q: A researcher has collected the following sample data Calculate coffined of variation, which is the…
A: From the provided information, Type of work Mean (µ) Standard deviation (σ) 1 100 20…
Q: The sodium content in various brands of hot dogs was measured and the results are shown in the table…
A: a) Consider that the mean and standard deviation of a random variable X are µ and σ, respectively.…
Q: A company conducts a consumer research project to examine whether a significant difference in…
A: Since you have posted a question with multiple sub-parts, we will solve first three sub-parts for…
Q: Assume that the weights of quarters are normally distributed with a mean of 5.67g and a standard…
A:
Q: The quality control department of Cool Cola tested the bottle fillers and found them to fill 500 mL…
A: Measure of central tendency measures the central or average value of a dataset. Mean, median and…
Q: 5. What is the chi-square value for a well counter that produced the following values for a…
A: Let the variable be x The 10 values are represented in a table below: serial no x 1 11148 2…
Q: a researcher reports an F-ratio with dfbetween =2 and dfwithin =30 for an independent measures ANOVA…
A: It is given that dfbetween = 2 and dfwithin=30.
Q: Percent that fall within 1.5 SD on both sides of the mean Percent that fall between the mean and…
A: a)Percent that fall within 1.5 SD on both sides of the mean P(-1.5 < Z< 1.5) = P(Z<1.5) -…
Q: For the following Even data set, calculate, rounding your answers to one decimal place when…
A: Given information: 7, 7, 9, 13, 13, 13, 14, 17, 19, 21
Q: The following readings were recorded for voltage measurement 12 , 9.5 , 8 , 9.5 , 12, 9.5 , 8 , 9 ,…
A: Data recorded for voltage measurement is 12 , 9.5 , 8 , 9.5 , 12, 9.5 , 8 , 9 , 12 , 9.5 The…
Q: Thirty automobiles were tested for their fuel efficiency in miles traveled per gallon of fuel using…
A:
Q: Find the Z-score that describes the following proportions under the normal curve (within 0.01…
A: We have given that, Z from the normal distribution with top 75% of scores then we will find the Z-…
Q: Students at a major university are complaining of a serious housing crunch. Many of the university's…
A: Based on the provided information, the mean distance is 14.7 miles and standard deviation is 3.1…
Q: What is the Lower Control Limit? Round your answer to three decimal places.
A:
Q: average heigth is 163 cm, standart deviation is 10 cm. compute p(X>168 cm) ?
A: Given,μ=163σ=10P(X>168)=?
Q: Find the Quartile Deviation for the following data : 391, 384, 591, 407, 672, 522, 777, 733, 1490,…
A:
Q: Find the Absolute Quartile Deviation for the following data. 042, 384, 591, 407, 672, 522, 777, 733,…
A: The first and the third quartile, obtained in excel using "QUANTILE.EXC()", is Q1 = 401.25 Q3 =…
Q: Use the box-and-whisker diagram to: (i) (ii) (iii) Determine the minimum and the maximum of th Сopy…
A: (i) According to box and whisker plot the minimum age is 30 and maximum age is 55. Q1=35, Q2=45,…
Q: 6. Calculate the average and standard deviation for the following set of calibration data: 3.8842,…
A:
Q: Find the mean absolute deviation for the data in the table. Round to the nearest tenth if necessary.…
A:
Q: Find a 95% CI on the population standard deviation of speeds of drivers ticketed in a 55 mph zone…
A: Confidence interval population standard deviation : A confidence interval is an statistical…
Q: Calculate both the sample and the population standard deviations using the data below. 22 30 7 28 3…
A: 22 6 36 30 14 196 7 -9 81 28 12 144 3 -13 169 6 -10 100
Q: Given the normally distributed variable X with mean 18 and standard deviation 3, find P (X s 15)
A:
Q: Use the given information to find the minimum sample size required to estimate an unknown population…
A: Margin of error, M.E = $500 Confidence level (α) = 95% σ =$1500
Q: Given the measurements 20, 26, 40, 39, 25, 36, and 34, compute for the following: 1. Mean 2. range…
A: Given that data 20, 26, 40, 39, 25, 36, and 34, Mean = sum of all observations/total number of…
Q: The following numerical results were obtained in a given laboratory experiment : 0.09376 , 0.09358 ,…
A: Here, x x-x (x-x)2 0.09376 0.00004 0.0000000016 0.09358 -0.00014 0.0000000196 0.09385…
Q: The following BTU measurements are taken relative to some chemical process: 1244, 1198, 1212, 1235,…
A:
Q: the following scores are from an interval measurement : 10, 20, 5, 15, 25 Please calculate all the…
A: Solution-: Given: 10,20,5,15,25 We prepare the following table: From this table we get,…
Q: g populstion of N=9 scores 4,2,0,5,3,2,1,7,3 C. compute ss, variane and standard deviation for the…
A: The mean is: The table that shows the necessary calculations is depicted as follows: x x−μ…
Q: IF babies Neighto are normally distributed with a mean ot 3.23ky and a standard deviantion of 0.87kg…
A:
Q: For the stem and leaf given below determine the following: 1. P10, 2. Standard deviation 1| 58, 92,…
A: The objective is to determine the percentile P10 and the standard deviation for the stem and leaf…
Q: A manufacturer of socks does a strength test of socks by stretching them until they tear. It is…
A: Given Socks within 3 standard deviations of the mean strength meet the standards
Q: Q1/ For the below frequency distribution table calculate all the below requiments. 1- Relative…
A: As per our guidelines we are supposed to answer only 3 sub-parts of any question so I am solving…
Q: Graph the mean of the following 10 samples (thickness of washers, coded values) on a control chart…
A: Given, Mean, μ = 5 Standard deviation, σ = 1.55 Sample size, n = 4 CL for mean chart = E(X) = μ = 5…
Q: A certain machine makes electrical resistors having a mean resistance of 50 ohms and a standard…
A:
Q: Which online stationery store has the best prices? An independent agency recently was asked to…
A:
Q: 9.20 Consider the situation of Exercise 9.11. Esti- mation of the mean diameter, while important, is…
A: Consider the data that shows the diameters of the metal pieces. 1.01 0.97 1.03 1.04 0.99 0.98…
Q: The state of California has a mean annual rainfall of 22 inches, whereas the state of New York has a…
A: 22 3 30 42 3 45 Mean of the sampling distribution of the sample mean. Standard…
Q: Complete the following table. Using the standard normal curve Percent that fall within 1.5 SD on…
A: Standard normal curve is the distribution curve of standard normal distribution. The standard normal…
Q: For the following population of N =6 scores: 2, 9 , 6, 8, 9, 8 (a) calculate the range and standard…
A: The range is obtained as 7, from the calculation given below:
Q: Given the following mean and standard deviation, find the z-score for each individual score. Find…
A:
Q: Use the given information to find the minimum sample size required to estimate an unknown population…
A: Determine the sample size n needed. Obtain the critical value of z at the 95% confidence level.…
Q: sales price for 25 homes in Casper is $294,220. Assume the population in Cheyenne is $287,984.…
A:
Q: EN: POPULATION MEAN: 94.60 AND POPULATION STANDARD DEVIATION: 2.3324 What is the percentage that a…
A:
Q: For a repeated –measures study comparing three treatment conditions with a sample n =4 participants,…
A:
Q: The next day, you measure 0.077 ± .0008 µg/mL. To 95% confidence, is this an outlier? Should you be…
A: From the question 1, The level 1 data values are, 0.0899-0.0008=0.0891 0.092-0.002=0.09…


Trending now
This is a popular solution!

Step by step
Solved in 2 steps


- Spacers are manufactured to the mean dimension and tolerance shown in Figure 29-12. An inspector measures 10 spacers and records the following thicknesses: 0.372" 0.376" 0.379" 0.375" 0.370" 0.373" 0.377" 0.378" 0.371" 0.380" Which spacers are defective (above the maximum limit or below the minimum limit)? All dimensions are in inches.To assess the air quality in a surgical suite, the presence of colony-forming spores per cubic meter of air is measured on three successive days. The results are as follows: {12, 24, 30}. Calculate the mean and standard deviation for these data.See the attached image for the introduction. Using your previous answer to part (b) above, give two-sided 95% confidence limits for the difference in mean percentage waste for supplier 3 and 4: µ3 − µ4. (Plug in completely, but you need not simplify.)
- (note: use mu for mean or average , p for proportion, >= for , <= for , =/ for ) State the null and alternative hypotheses to be used in testing the following claims and determine generally where the critical region is located: (a) The mean snowfall at Lake George during the month of February is 21.8 centimeters. Ho: Blank 1 H1: Blank 2 (b) No more than 20% of the faculty at the local university contributed to the annual giving fund. Ho: Blank 3 H1: Blank 4 (c) At least 70% of next year's new cars will be in the compact and subcompact category. Ho: Blank 5 H1: Blank 6 (d) The average rib-eye steak at the Longhorn Steak house is at least 340 grams. Ho: Blank 7 H1: Blank 8Given the same R software output below, is there sufficient evidence to say that the mean diameter of Penicillium roqueforti colonies grown on petri dishes filled with malt extract agar is not equal to 40.0 mm, at 5% level of significance?To determine if their 0.33 centimeter bolts are properly adjusted, Harper Manufacturing has decided to use an x‾-Chart which uses the range to estimate the variability in the sample. Average value 0.370 Step 1 of 7: What is the Center Line of the control chart? Round your answer to three decimal places. Step 2 of 7: What is the Upper Control Limit? Round your answer to three decimal places. Step 3 of 7: What is the Lower Control Limit? Round your answer to three decimal places. Step 4 of 7: Use the following sample data, taken from the next time period, to determine if the process is "In Control" or "Out of Control".Observations: 0.38,0.31,0.36,0.31,0.36,0.370.38,0.31,0.36,0.31,0.36,0.37Sample Mean: 0.34830.3483 Step 5 of 7: Use the following sample data, taken from the next time period, to determine if the process is "In Control" or "Out of Control".Observations:…
- The control limits for a 3-sigma c chart with n=2 when the process average is equal to 8 nonconformities for one inspection unit are Select one: a. LCL=0 UCL=16.5 b. LCL=-0.5 UCL=16.5 c. LCL=4 UCL=28 d. LCL=0 UCL=28 e. LCL=-4 UCL=28(a)(c) For each of the accompanying scenarios, figure the estimated effect size (and whether it is approximately small, medium, or large by Cohen's conventions, using midpoints between conventions as thresholds separating small and large from medium). In each case, assume differences are calculated by subtracting values for Sample 2 from values for Sample 1.(d) Explain your answer for scenario (a) to a person who understands the t test for independent means but is unfamiliar with effect size.The accounting department at Weston Materials, Inc., a national manufacturter of unattached garages, reports that it takes two construction workers a mean of 32 hours and a standard deviatuon of 2 hours to build the Red Barn model. Assume the aseembly times follow the normal distribution. m=32 o=2 a) What percent of the garages take 35 or more hours to build
- The better-selling candies are often high in calories. Assume that the following data show the calorie content from samples of M&M’s, Kit Kat, and Milky Way II. Test for significant differences among the calorie content of these three candies. At a .05 level of significance, what is the p-valueUse the following two control charts that result from testing batches of newly manufactured aircraft altimeters, with 100 in each batch. The original sample values are errors (in feet) obtained when the altimeters are tested in a pressure chamber that simulates an altitude of 6000ft. The Federal Aviation Administration requires an error of no more than 40 ft at that altitude. Is the process variation within statistical control? Why or why not?The following BTU measurements are taken relative to some chemical process: 1244, 1198, 1212, 1235, 1245, 1190, 1202, 1220, 1233, 1208. A problem with the process is indicated if the mean BTU measurement varies too greatly from 1230. Given the aforementioned data, the hypotheses H0: µ = 1230 and H1: µ ≠ 1230, and α = 0.05, do the data indicate a problem with the chemical process? a. As |-1.72| < 1.833, the data do not indicate a problem with the chemical process. b. As |-1.72| < 2.262, the data do not indicate a problem with the chemical process. c. As |-1.72| < 1.833, the data indicate a problem with the chemical process. d. As |-1.72| < 2.262, the data indicate a problem with the chemical process. e. As |-1.81| < 1.833, the data do not indicate a problem with the chemical process. f. As |-1.81| < 2.262, the data do not indicate a problem with the chemical process. g. As |-1.81| < 2.262, the data indicate a…
