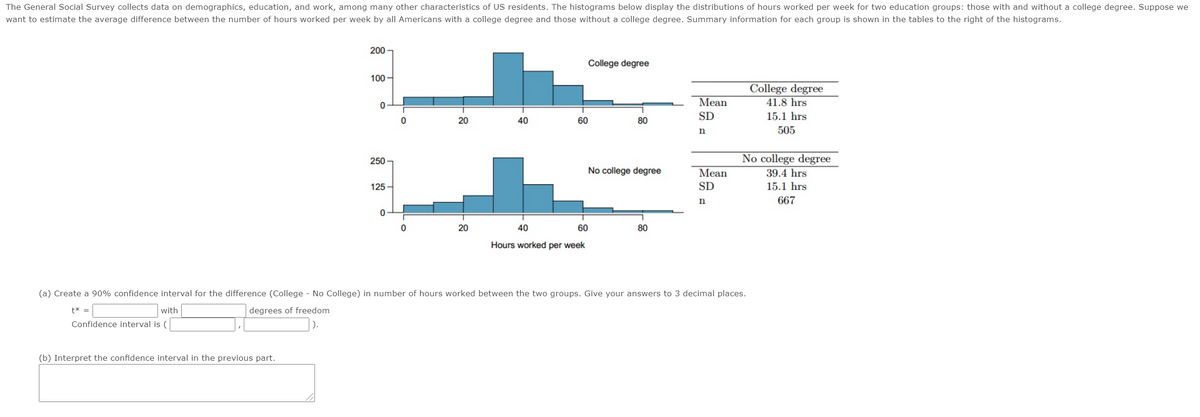
The General Social Survey collects data on demographics, education, and work, among many other characteristics of US residents. The histograms below display the distributions of hours worked per week for two education groups: those with and without a college degree. Suppose we want to estimate the average difference between the number of hours worked per week by all Americans with a college degree and those without a college degree. Summary information for each group is shown in the tables to the right of the histograms. 200 College degree 100 - College degree Mean 41.8 hrs SD 15.1 hrs 20 40 60 80 n 505 No college degree 250 - No college degree Mean 39.4 hrs 125 - SD 15.1 hrs n 667 20 40 60 80 Hours worked per week (a) Create a 90% confidence interval for the difference (College - No College) in number of hours worked between the two groups. Give your answers to 3 decimal places. with degrees freedom Confidence interval is ( (b) Interpret the confidence interval in the previous part.


Inverse Normal Distribution
The method used for finding the corresponding z-critical value in a normal distribution using the known probability is said to be an inverse normal distribution. The inverse normal distribution is a continuous probability distribution with a family of two parameters.
Mean, Median, Mode
It is a descriptive summary of a data set. It can be defined by using some of the measures. The central tendencies do not provide information regarding individual data from the dataset. However, they give a summary of the data set. The central tendency or measure of central tendency is a central or typical value for a probability distribution.
Z-Scores
A z-score is a unit of measurement used in statistics to describe the position of a raw score in terms of its distance from the mean, measured with reference to standard deviation from the mean. Z-scores are useful in statistics because they allow comparison between two scores that belong to different normal distributions.


Trending now
This is a popular solution!

Step by step
Solved in 2 steps with 2 images


