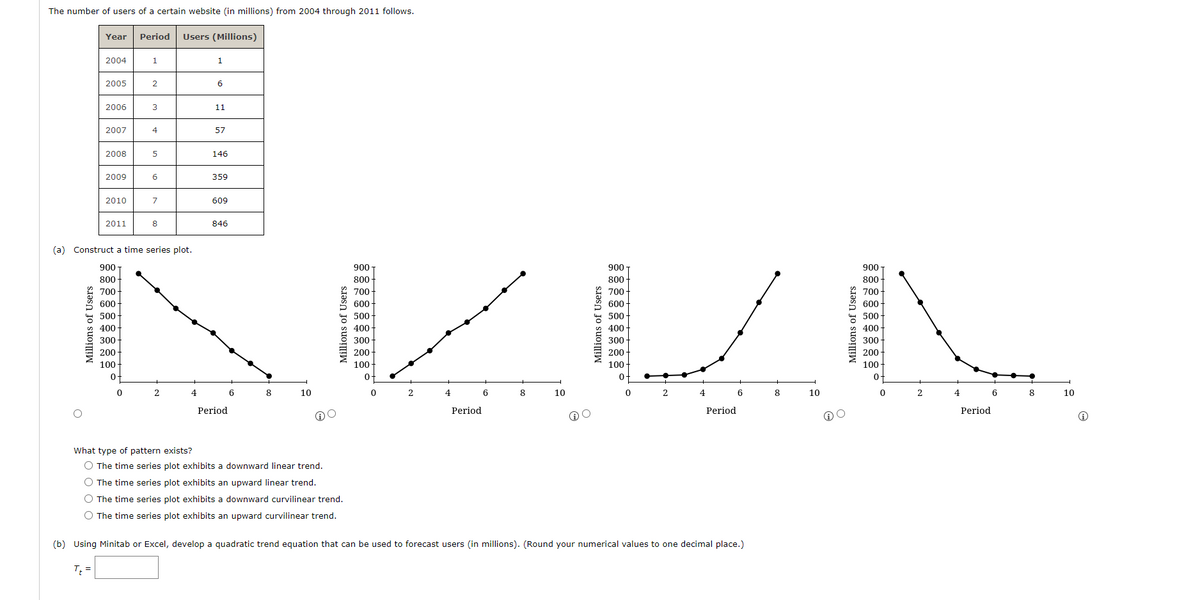
The number of users of a certain website (in millions) from 2004 through 2011 follows. Year Period Users (Millions) 2004 1 1 2005 2 6 2006 11 2007 4 57 2008 146 2009 6. 359 2010 609 2011 846 (a) Construct a time series plot. 900 800 700 600 능 5001 400 900 800 700 600- 능 500 400 300 200 100 of 900 900 - 800- 700- 600 능 5001 400 300 200 100 of 800- 700 600- 500 400 300 200 100- 300 200- 100 2 10 6. 10 4 10 4 10 Period Period Period Period What type of pattern exists? The time series plot exhibits a downward linear trend. O The time series plot exhibits an upward linear trend. O The time series plot exhibits a downward curvilinear trend. O The time series plot exhibits an upward curvilinear trend. Millions of Users
The number of users of a certain website (in millions) from 2004 through 2011 follows. Year Period Users (Millions) 2004 1 1 2005 2 6 2006 11 2007 4 57 2008 146 2009 6. 359 2010 609 2011 846 (a) Construct a time series plot. 900 800 700 600 능 5001 400 900 800 700 600- 능 500 400 300 200 100 of 900 900 - 800- 700- 600 능 5001 400 300 200 100 of 800- 700 600- 500 400 300 200 100- 300 200- 100 2 10 6. 10 4 10 4 10 Period Period Period Period What type of pattern exists? The time series plot exhibits a downward linear trend. O The time series plot exhibits an upward linear trend. O The time series plot exhibits a downward curvilinear trend. O The time series plot exhibits an upward curvilinear trend. Millions of Users

Managerial Economics: Applications, Strategies and Tactics (MindTap Course List)
14th Edition
ISBN:9781305506381
Author:James R. McGuigan, R. Charles Moyer, Frederick H.deB. Harris
Publisher:James R. McGuigan, R. Charles Moyer, Frederick H.deB. Harris
Chapter5: Business And Economic Forecasting
Section: Chapter Questions
Problem 1.2CE: Plot the logarithm of arrivals for each transportation mode against time, all on the same graph....

Related questions
Question
Transcribed Image Text:The number of users of a certain website (in millions) from 2004 through 2011 follows.
Year
Period
Users (Millions)
2004
1.
2005
2
2006
11
2007
4
57
2008
146
2009
6.
359
2010
7
609
2011
846
(a) Construct a time series plot.
900
900
900 -
900 -
800
800
800 -
800 -
700
700
700-
700 -
600
600
600
600
500-
400-
500
500
500-
400
400
400 -
300-
300
300-
300 -
200-
100-
200
200-
200
100-
100-
100
2
4
6.
8
10
4
6
8
10
8
10
2.
4
6
8
10
Period
Period
Period
Period
What type of pattern exists?
O The time series plot exhibits a downward linear trend.
O The time series plot exhibits an upward linear trend.
O The time series plot exhibits a downward curvilinear trend.
O The time series plot exhibits an upward curvilinear trend.
(b) Using Minitab or Excel, develop a quadratic trend equation that can be used to forecast users (in millions). (Round your numerical values to one decimal place.)
T =
Millions of Users
Millions of Users
Expert Solution
This question has been solved!
Explore an expertly crafted, step-by-step solution for a thorough understanding of key concepts.

This is a popular solution!

Trending now
This is a popular solution!

Step by step
Solved in 4 steps with 2 images

Knowledge Booster


Learn more about
Need a deep-dive on the concept behind this application? Look no further. Learn more about this topic, economics and related others by exploring similar questions and additional content below.Recommended textbooks for you
Managerial Economics: Applications, Strategies an…
Economics
ISBN:
9781305506381
Author:
James R. McGuigan, R. Charles Moyer, Frederick H.deB. Harris
Publisher:
Cengage Learning
Managerial Economics: Applications, Strategies an…
Economics
ISBN:
9781305506381
Author:
James R. McGuigan, R. Charles Moyer, Frederick H.deB. Harris
Publisher:
Cengage Learning