The following graph represents the money market in a hypothetical economy. This economy has a central bank, similar to the Bank of Canada, called the Fed. Unlike in Canada, the economy is closed (that is, the economy does not interact with other economies in the world). The money market is currently in equilibrium at an interest rate of 5.5% and a quantity of money equal to $0.4 trillion, as indicated by the grey star. NTEREST RATE (Percent) 7.5 7.0 6.5 6.0 5.5 5.0 4.5 4.0 3.5 0 Money Demand 0.1 Money Supply 0.6 0.3 0.4 0.5 MONEY (Trillions of dollars) 0.2 0.7 the demand for or supply of 0.8 New MS Curve New Equilibrium ? Suppose the Fed announces that it is raising its target interest rate by 50 basis points, or 0.5 percentage point. To do this, the Fed will use open- market operations to decrease or the public. money by buying bonds from or selling bonds to increase Use the green line (triangle symbol) on the previous graph to illustrate the effects of this policy by placing the new money supply curve (MS) in the
The following graph represents the money market in a hypothetical economy. This economy has a central bank, similar to the Bank of Canada, called the Fed. Unlike in Canada, the economy is closed (that is, the economy does not interact with other economies in the world). The money market is currently in equilibrium at an interest rate of 5.5% and a quantity of money equal to $0.4 trillion, as indicated by the grey star. NTEREST RATE (Percent) 7.5 7.0 6.5 6.0 5.5 5.0 4.5 4.0 3.5 0 Money Demand 0.1 Money Supply 0.6 0.3 0.4 0.5 MONEY (Trillions of dollars) 0.2 0.7 the demand for or supply of 0.8 New MS Curve New Equilibrium ? Suppose the Fed announces that it is raising its target interest rate by 50 basis points, or 0.5 percentage point. To do this, the Fed will use open- market operations to decrease or the public. money by buying bonds from or selling bonds to increase Use the green line (triangle symbol) on the previous graph to illustrate the effects of this policy by placing the new money supply curve (MS) in the

Macroeconomics: Private and Public Choice (MindTap Course List)
16th Edition
ISBN:9781305506756
Author:James D. Gwartney, Richard L. Stroup, Russell S. Sobel, David A. Macpherson
Publisher:James D. Gwartney, Richard L. Stroup, Russell S. Sobel, David A. Macpherson
Chapter13: Money And The Banking System
Section: Chapter Questions
Problem 16CQ

Related questions
Question
please als do the graphs. thanksssssssss
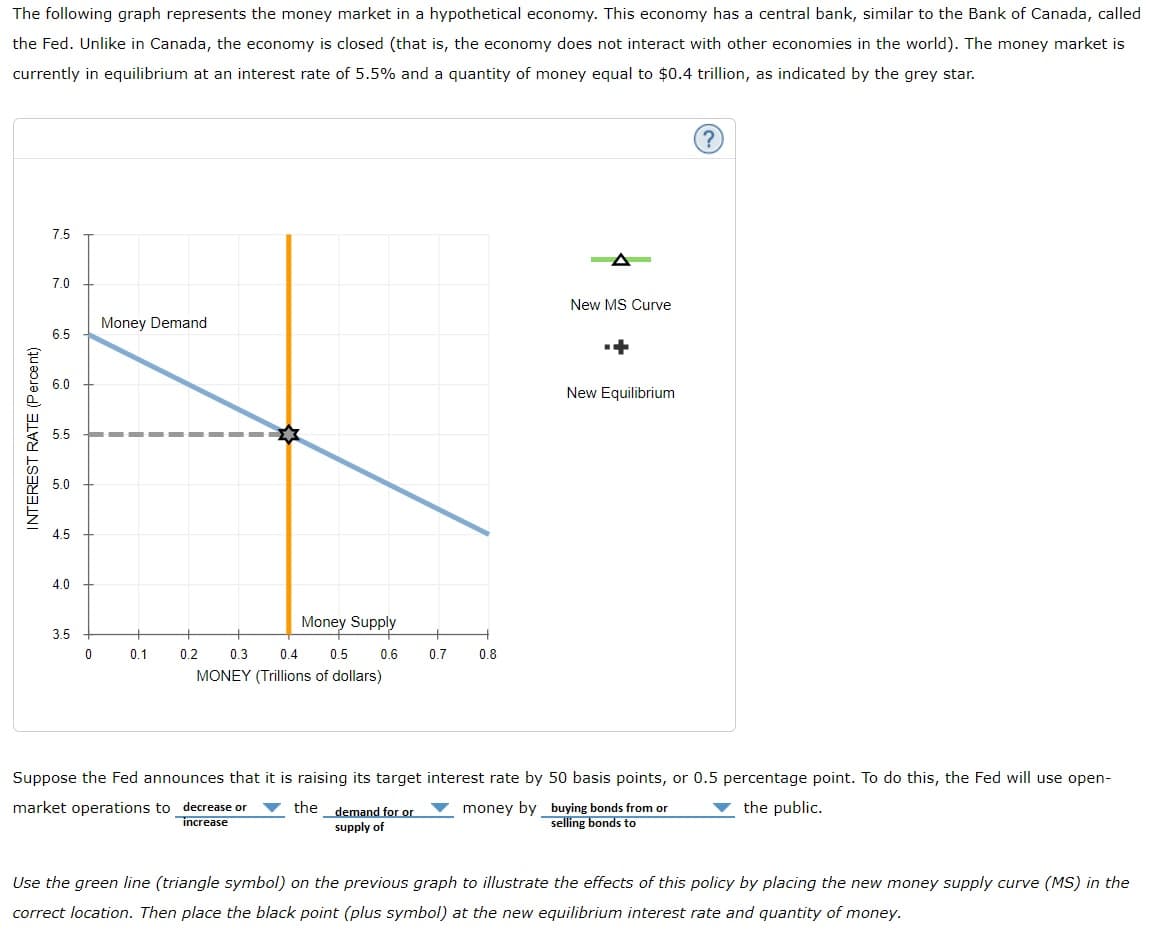
Transcribed Image Text:The following graph represents the money market in a hypothetical economy. This economy has a central bank, similar to the Bank of Canada, called
the Fed. Unlike in Canada, the economy is closed (that is, the economy does not interact with other economies in the world). The money market is
currently in equilibrium at an interest rate of 5.5% and a quantity of money equal to $0.4 trillion, as indicated by the grey star.
INTEREST RATE (Percent)
7.5
7.0
6.5
6.0
5.5
5.0
4.5
4.0
3.5
0
Money Demand
0.1
0.2
Money Supply
0.3
0.4
0.5
MONEY (Trillions of dollars)
0.6
0.7
demand for or
supply of
0.8
New MS Curve
New Equilibrium
?)
Suppose the Fed announces that it is raising its target interest rate by 50 basis points, or 0.5 percentage point. To do this, the Fed will use open-
market operations to decrease or the
money by
buying bonds from or
selling bonds to
the public.
increase
Use the green line (triangle symbol) on the previous graph to illustrate the effects of this policy by placing the new money supply curve (MS) in the
correct location. Then place the black point (plus symbol) at the new equilibrium interest rate and quantity of money.
Transcribed Image Text:Use the green line (triangle symbol) on the previous graph to illustrate the effects of this policy by placing the new money supply curve (MS) in the
correct location. Then place the black point (plus symbol) at the new equilibrium interest rate and quantity of money.
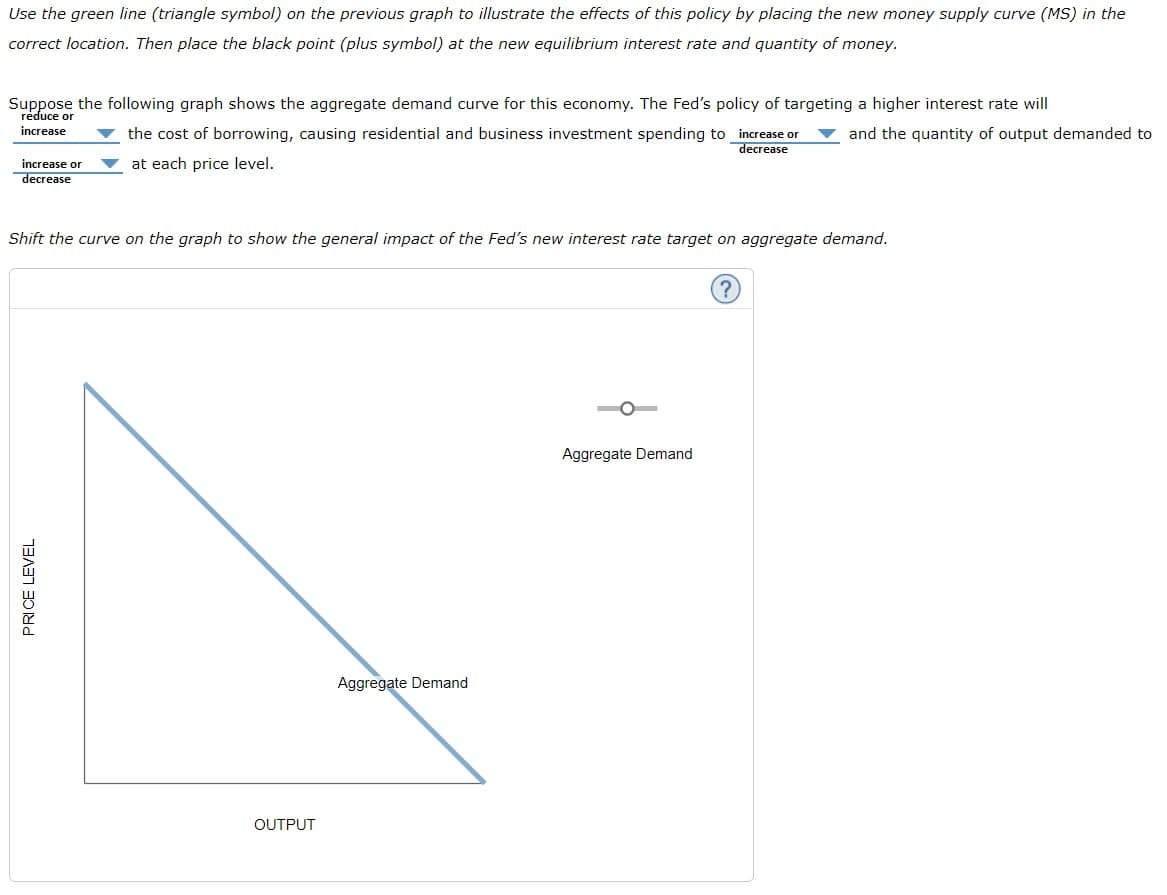
Suppose the following graph shows the aggregate demand curve for this economy. The Fed's policy of targeting a higher interest rate will
reduce or
increase
and the quantity of output demanded to
increase or
decrease
the cost of borrowing, causing residential and business investment spending to increase or
decrease
at each price level.
Shift the curve on the graph to show the general impact of the Fed's new interest rate target on aggregate demand.
PRICE LEVEL
OUTPUT
Aggregate Demand
Aggregate Demand
Expert Solution
This question has been solved!
Explore an expertly crafted, step-by-step solution for a thorough understanding of key concepts.

Step by step
Solved in 2 steps with 2 images

Knowledge Booster


Learn more about
Need a deep-dive on the concept behind this application? Look no further. Learn more about this topic, economics and related others by exploring similar questions and additional content below.Recommended textbooks for you
Macroeconomics: Private and Public Choice (MindTa…
Economics
ISBN:
9781305506756
Author:
James D. Gwartney, Richard L. Stroup, Russell S. Sobel, David A. Macpherson
Publisher:
Cengage Learning

Economics: Private and Public Choice (MindTap Cou…
Economics
ISBN:
9781305506725
Author:
James D. Gwartney, Richard L. Stroup, Russell S. Sobel, David A. Macpherson
Publisher:
Cengage Learning

Macroeconomics: Private and Public Choice (MindTa…
Economics
ISBN:
9781305506756
Author:
James D. Gwartney, Richard L. Stroup, Russell S. Sobel, David A. Macpherson
Publisher:
Cengage Learning
Economics: Private and Public Choice (MindTap Cou…
Economics
ISBN:
9781305506725
Author:
James D. Gwartney, Richard L. Stroup, Russell S. Sobel, David A. Macpherson
Publisher:
Cengage Learning


