The goal of the project is to practice conducting a hypothesis test for a mean and proportion with re failed assumptions tests. Use primary methods described in text and used on homework.
The goal of the project is to practice conducting a hypothesis test for a mean and proportion with re failed assumptions tests. Use primary methods described in text and used on homework.

Algebra & Trigonometry with Analytic Geometry
13th Edition
ISBN:9781133382119
Author:Swokowski
Publisher:Swokowski
Chapter1: Fundamental Concepts Of Algebra
Section1.2: Exponents And Radicals
Problem 87E

Related questions
Question
Transcribed Image Text:1
2
3
4
5
6
7
8
9
10
1
12
13
4
15
16
17
18
19
20
21
22
23
24
25
26
27
28
29
30
31
32
33
34
35
36
37
Age
A
B
Gender
24 M
23 M
20 F
27 M
40 F
24 F
20 F
43 M
21 F
32 F
21 M
30 F
36 F
19 M
38 M
32 M
22 M
21 F
20 F
19 M
30 F
20 M
с
D
Limits
Freq.
Mid.
RF
CF
Ogive:
Polygon
Total:
E
Points
2222
1
2
2
2
2
2
3
3
25
F
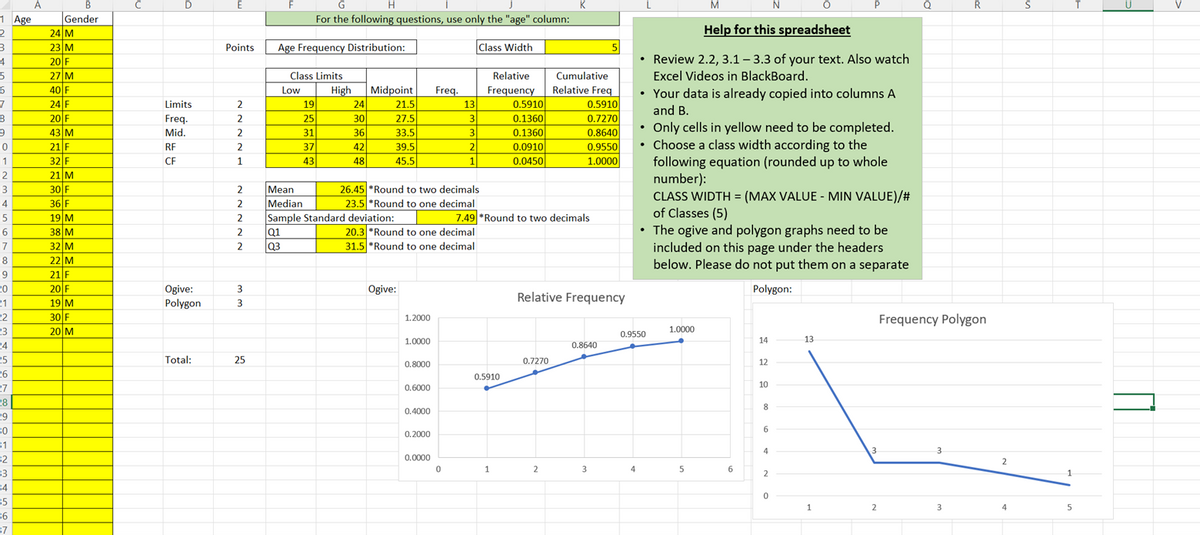
Age Frequency Distribution:
Class Limits
19
25
31
37
43
G
H
K
For the following questions, use only the "age" column:
Class Width
5
Midpoint Freq.
24
21.5
30
27.5
Relative Cumulative
Frequency
Relative Freq
13
0.5910
0.1360
0.1360
0.0910
0.0450
3
36
33.5
0.5910
0.7270
0.8640
0.9550
1.0000
42
3
2
1
39.5
48
45.5
26.45 *Round to two decimals
23.5 *Round to one decimal
7.49 *Round to two decimals
20.3 *Round to one decimal
31.5 *Round to one decimal
Ogive:
1.2000
1.0000
0.8000
0.6000
0.4000
0.2000
0.0000
Low
High
Mean
Median
Sample Standard deviation:
Q1
Q3
0
0.5910
1
Relative Frequency
0.8640
0.7270
2
3
M
N
P
Q
Help for this spreadsheet
• Review 2.2, 3.1-3.3 of your text. Also watch
Excel Videos in BlackBoard.
• Your data is already copied into columns A
and B.
Only cells in yellow need to be completed.
• Choose a class width according to the
following equation (rounded up to whole
number):
CLASS WIDTH=(MAX VALUE-MIN VALUE)/#
of Classes (5)
• The ogive and polygon graphs need to be
included on this page under the headers
below. Please do not put them on a separate
Polygon:
1.0000
14
12
10
5
0.9550
4
6
8
6
4
2
0
13
1
Frequency Polygon
3
3
2
R
3
2
4
S
1
5
T
U
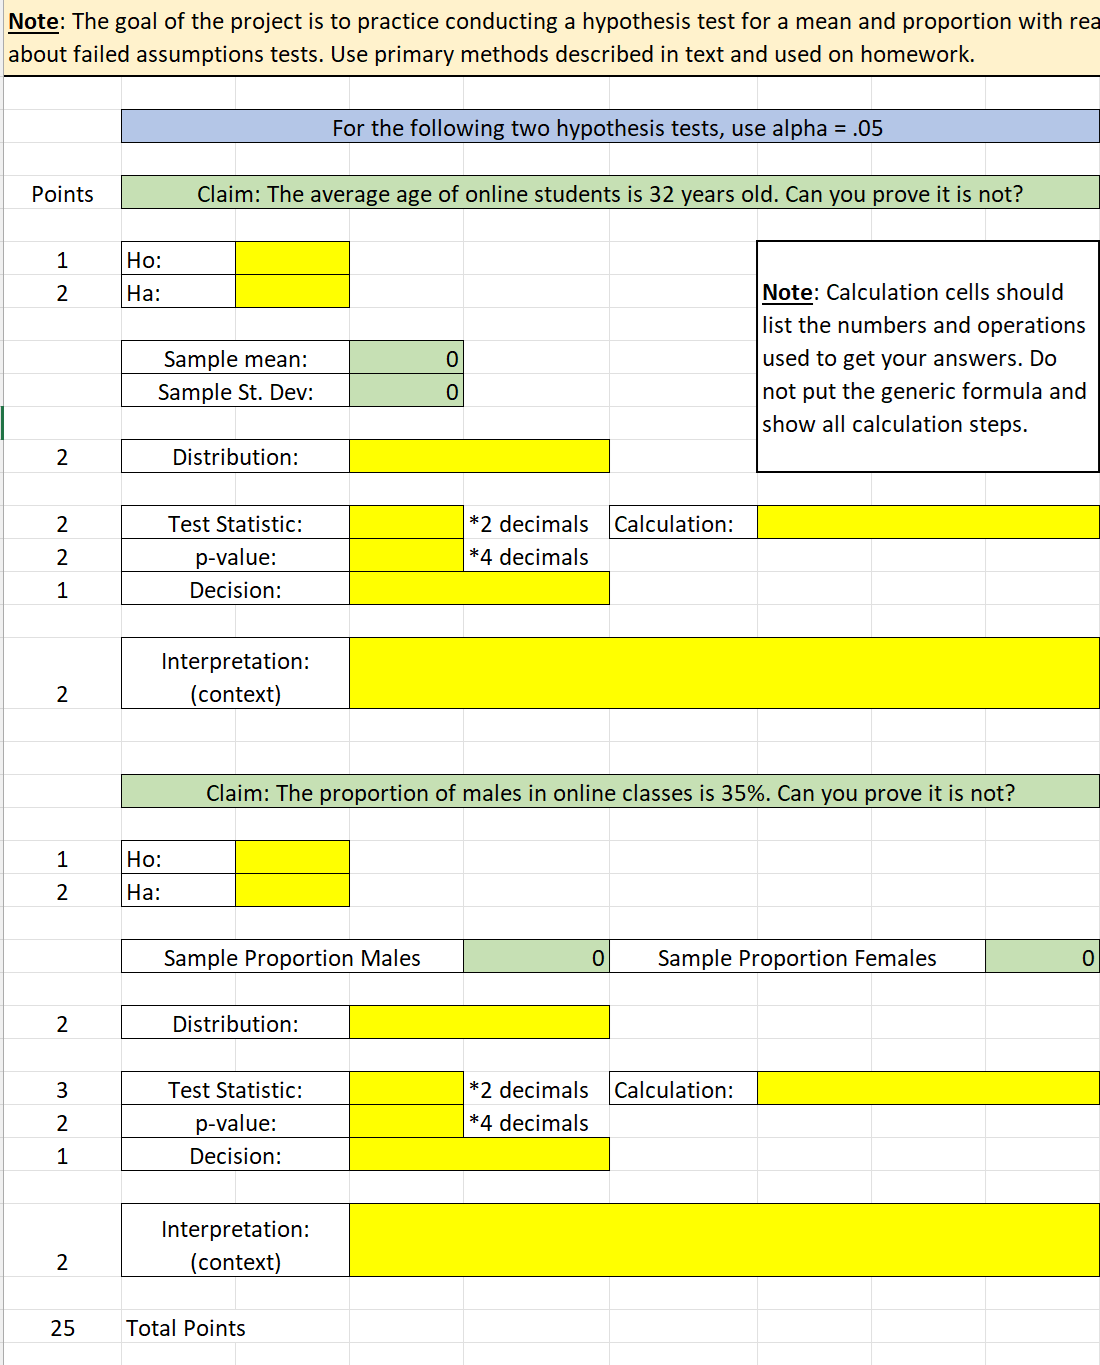
Transcribed Image Text:Note: The goal of the project is to practice conducting a hypothesis test for a mean and proportion with rea
about failed assumptions tests. Use primary methods described in text and used on homework.
For the following two hypothesis tests, use alpha = .05
Points
Claim: The average age of online students is 32 years old. Can you prove it is not?
1
Ho:
2
Ha:
Sample mean:
Sample St. Dev:
0
0
Note: Calculation cells should
list the numbers and operations
used to get your answers. Do
not put the generic formula and
show all calculation steps.
2
Distribution:
2
Test Statistic:
*2 decimals Calculation:
*4 decimals
2
p-value:
1
Decision:
Interpretation:
(context)
2
Claim: The proportion of males in online classes is 35%. Can you prove it is not?
1
Ho:
2
Ha:
Sample Proportion Males
0 Sample Proportion Females
0
2
Distribution:
3
Test Statistic:
p-value:
Decision:
Interpretation:
(context)
INW
2
1
2
25 Total Points
*2 decimals Calculation:
*4 decimals
Expert Solution
This question has been solved!
Explore an expertly crafted, step-by-step solution for a thorough understanding of key concepts.

This is a popular solution!

Trending now
This is a popular solution!

Step by step
Solved in 2 steps

Recommended textbooks for you
Algebra & Trigonometry with Analytic Geometry
Algebra
ISBN:
9781133382119
Author:
Swokowski
Publisher:
Cengage

College Algebra (MindTap Course List)
Algebra
ISBN:
9781305652231
Author:
R. David Gustafson, Jeff Hughes
Publisher:
Cengage Learning
Algebra & Trigonometry with Analytic Geometry
Algebra
ISBN:
9781133382119
Author:
Swokowski
Publisher:
Cengage
College Algebra (MindTap Course List)
Algebra
ISBN:
9781305652231
Author:
R. David Gustafson, Jeff Hughes
Publisher:
Cengage Learning