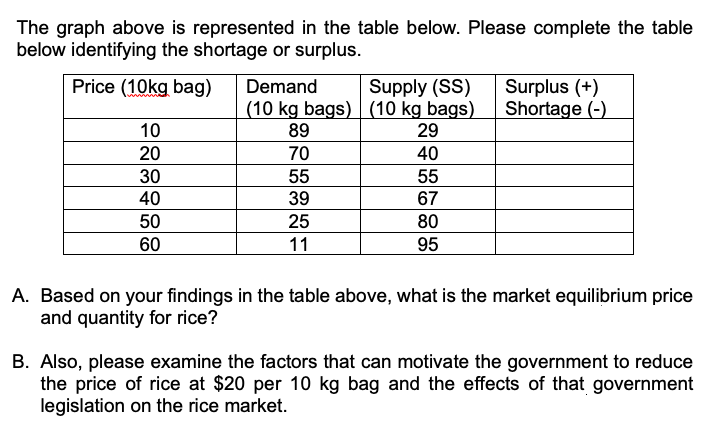
The graph above is represented in the table below. Please complete the table below identifying the shortage or surplus. Price (10kg bag) Supply (SS) (10 kg bags) (10 kg bags) 29 Demand Surplus (+) Shortage (-) 10 89 20 70 40 30 55 55 40 39 67 50 25 80 60 11 95 A. Based on your findings in the table above, what is the market equilibrium price and quantity for rice? B. Also, please examine the factors that can motivate the government to reduce the price of rice at $20 per 10 kg bag and the effects of that government legislation on the rice market.
The graph above is represented in the table below. Please complete the table below identifying the shortage or surplus. Price (10kg bag) Supply (SS) (10 kg bags) (10 kg bags) 29 Demand Surplus (+) Shortage (-) 10 89 20 70 40 30 55 55 40 39 67 50 25 80 60 11 95 A. Based on your findings in the table above, what is the market equilibrium price and quantity for rice? B. Also, please examine the factors that can motivate the government to reduce the price of rice at $20 per 10 kg bag and the effects of that government legislation on the rice market.

Chapter4: Markets In Action
Section: Chapter Questions
Problem 1SQP

Related questions
Question
Transcribed Image Text:The graph above is represented in the table below. Please complete the table
below identifying the shortage or surplus.
Price (10kg bag)
Supply (SS)
(10 kg bags) (10 kg bags)
29
Demand
Surplus (+)
Shortage (-)
10
89
20
70
40
30
55
55
40
39
67
50
25
80
60
11
95
A. Based on your findings in the table above, what is the market equilibrium price
and quantity for rice?
B. Also, please examine the factors that can motivate the government to reduce
the price of rice at $20 per 10 kg bag and the effects of that government
legislation on the rice market.
Expert Solution
This question has been solved!
Explore an expertly crafted, step-by-step solution for a thorough understanding of key concepts.

This is a popular solution!

Trending now
This is a popular solution!

Step by step
Solved in 3 steps

Recommended textbooks for you


Microeconomics: Principles & Policy
Economics
ISBN:
9781337794992
Author:
William J. Baumol, Alan S. Blinder, John L. Solow
Publisher:
Cengage Learning