The table below shows the demand and supply schedules for bleach. PRICE (per litre) QUANTITY DEMANDED (litres per week) $ 24 5 21 18 15 12 QUANTITY SUPPLIED (litres per week) 60 50 40 30 20 10 10 20 30 40 9 50 6 60 A. Draw the demand and supply curves on the graph paper provided. B. Indicate the equilibrium price and quantity. C. Suppose the government decides that the price of bleach is too high and imposes a price ceiling of $12, what would be the impact of such a ceiling? 529 5 "1
The table below shows the demand and supply schedules for bleach. PRICE (per litre) QUANTITY DEMANDED (litres per week) $ 24 5 21 18 15 12 QUANTITY SUPPLIED (litres per week) 60 50 40 30 20 10 10 20 30 40 9 50 6 60 A. Draw the demand and supply curves on the graph paper provided. B. Indicate the equilibrium price and quantity. C. Suppose the government decides that the price of bleach is too high and imposes a price ceiling of $12, what would be the impact of such a ceiling? 529 5 "1

Principles of Microeconomics
7th Edition
ISBN:9781305156050
Author:N. Gregory Mankiw
Publisher:N. Gregory Mankiw
Chapter6: Supply, Demand And Government Policies
Section: Chapter Questions
Problem 3PA

Related questions
Question
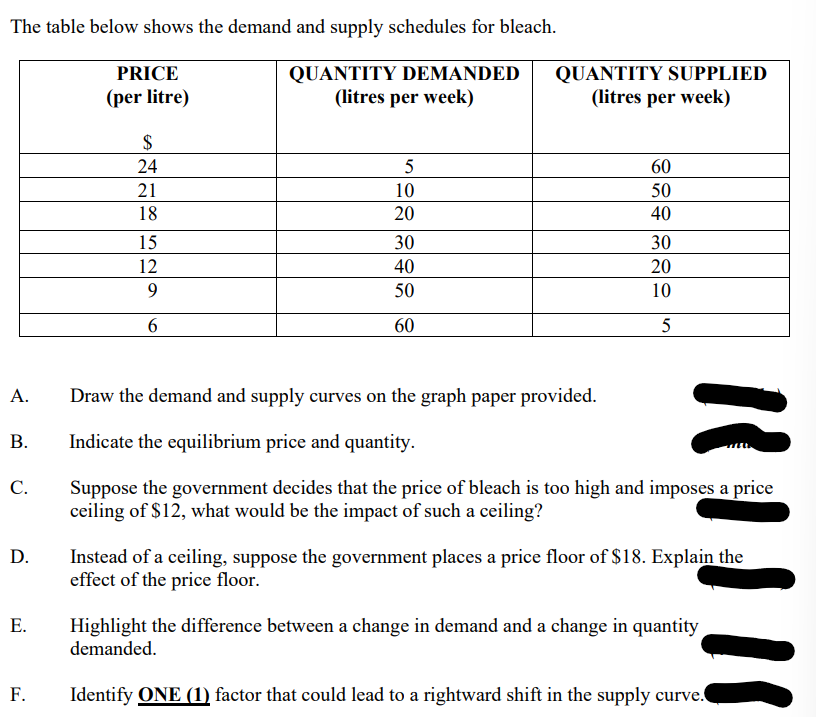
Transcribed Image Text:The table below shows the demand and supply schedules for bleach.
PRICE
(per litre)
QUANTITY DEMANDED
(litres per week)
$
24
5
21
10
18
20
15
30
12
40
9
50
6
60
A.
Draw the demand and supply curves on the graph paper provided.
B.
Indicate the equilibrium price and quantity.
C.
Suppose the government decides that the price of bleach is too high and imposes a price
ceiling of $12, what would be the impact of such a ceiling?
D.
Instead of a ceiling, suppose the government places a price floor of $18. Explain the
effect of the price floor.
E.
Highlight the difference between a change in demand and a change in quantity
demanded.
F.
Identify ONE (1) factor that could lead to a rightward shift in the supply curve.
QUANTITY SUPPLIED
(litres per week)
60
50
40
30
20
10
5
"1
11
Expert Solution
This question has been solved!
Explore an expertly crafted, step-by-step solution for a thorough understanding of key concepts.

Step by step
Solved in 3 steps with 1 images

Knowledge Booster


Learn more about
Need a deep-dive on the concept behind this application? Look no further. Learn more about this topic, economics and related others by exploring similar questions and additional content below.Recommended textbooks for you
Principles of Microeconomics
Economics
ISBN:
9781305156050
Author:
N. Gregory Mankiw
Publisher:
Cengage Learning


Principles of Microeconomics
Economics
ISBN:
9781305156050
Author:
N. Gregory Mankiw
Publisher:
Cengage Learning


Exploring Economics
Economics
ISBN:
9781544336329
Author:
Robert L. Sexton
Publisher:
SAGE Publications, Inc